

.svg)
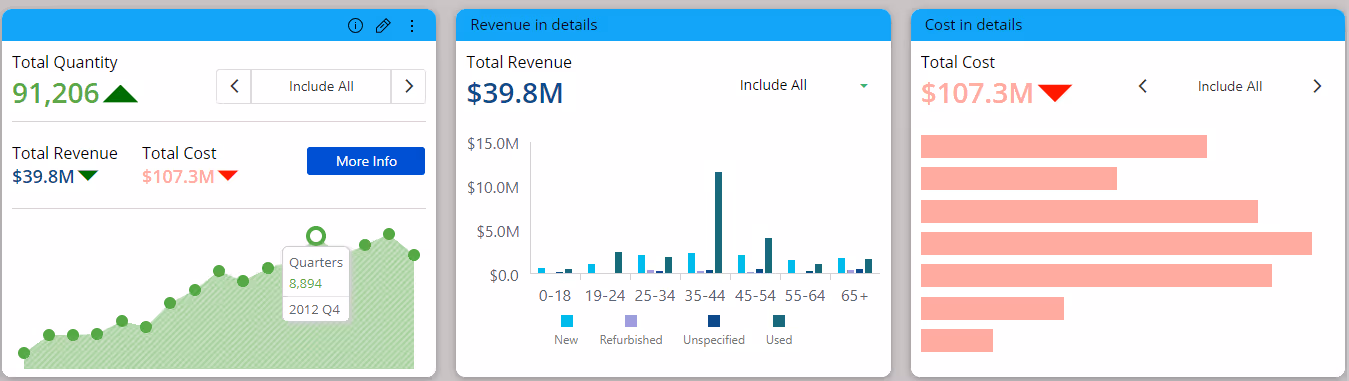
Adaptive Indicator Card
Effortlessly present rich data insights, indicators and trends while optimizing your dashboard layout
Experience Data Clarity and Efficiency like never before with Paldi’s Adaptive Indicator Card Sisense plugin.
This feature-rich plugin empowers you to present multiple indicators with important information in a compact widget area.
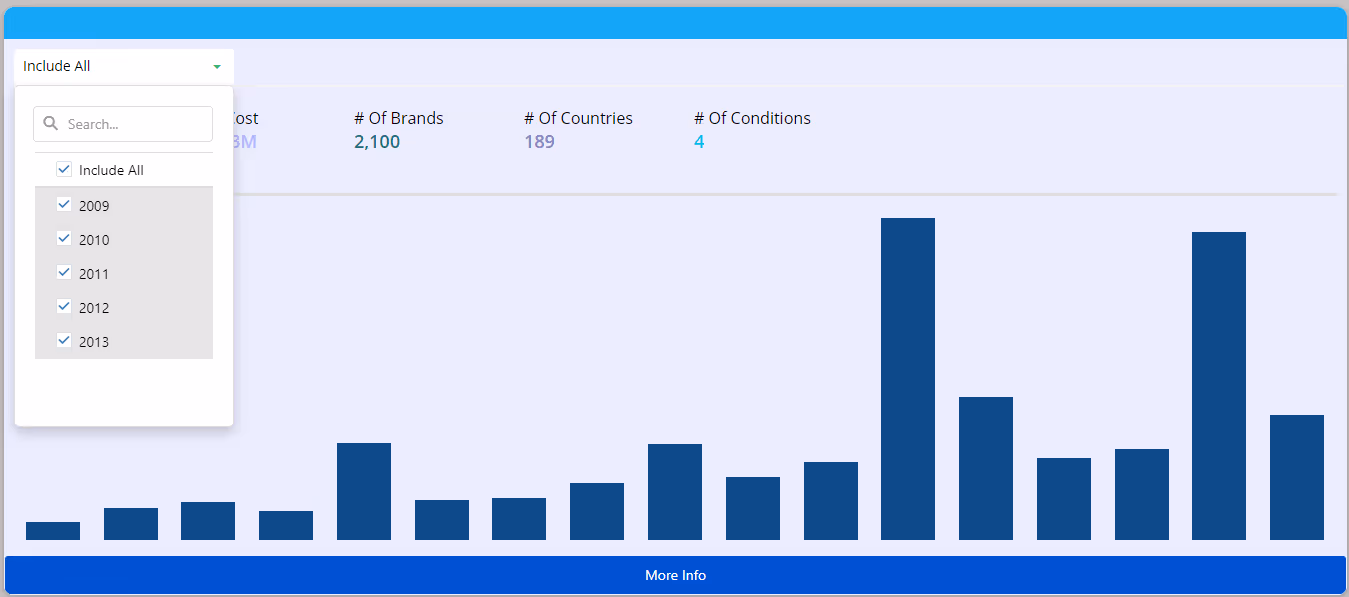
With countless available templates, design options, multiple sparkline choices, in-widget filtering, and in-widget jump-to-dashboard features, it provides you with extensive analytical capabilities while optimizing your limited dashboard space, all without requiring a single line of code.

See it in Action:
Key Highlights
- Customizable Templates: Create your own templates with endless styling possibilities.
- Multiple Sparkline/Chart Options: Bar, Area, Column, and Line charts available.
- Integrated with Paldi’s Jump-to-Dashboard Engine: Designers can configure Advanced Jump-To-Dashboard functionality.
- Integrated with Paldi’s Advanced Tooltip Engine: Designers can define and style data tooltips.
- Interactive Indicators: All indicators interact with the sparkline for responsive insights.
- Trend Customization: Define trend images and icons to reflect changing data.
- In-Widget Filtering: Streamline data analysis by filtering within the widget.
- Zero Coding Approach: Part of the code-free Paldi experience.
Key Features
- Multiple KPIs: Main KPI and multiple Secondary KPIs
- Sparkline Styling Customization
- Dynamic Trend Icons: Adapt icons to represent changing data trends.
- Axis Label Customization: Customize axis labels for contextual clarity.
- Creative Design Control: Enjoy full creative control over widget design.
- Supports Break-by Analysis: Analyze data with support for breaking it down.
Screenshots:

See this plugin in action
Get a personalized demo and discover how PALDI Solutions can transform your Sisense dashboards.
Book a free demo
Browse 70+ Certified Add-Ons
Go to Sisense Add-ons MarketplaceGo to Sisense Add-ons Marketplace
Enhance your Sisense Experience With our Top Rated Reporting Suite
Clients who use these with the Exports Enhancements
see faster adoption, richer insights, and greater ROI.
see faster adoption, richer insights, and greater ROI.


Flexi BloX
Build rich, custom layouts in Sisense dashboards with drag-and-drop control — no code needed
Best Seller

Advanced Table With Aggregation
Discover a vast array of powerful new capabilities to help elevate your tables to the next level!
Best Seller

Advanced Expandable Pivot Table
Get maximum analytics capabilities with Paldi’s Expandable Pivot plugin.
Best Seller

Leave the implementation to us.
"With the help of Paldi Plugins, you can just click and it’s there.
We were able to leverage Sisense to create a better user experience from a designer and user perspective."

HAMZA
/ Head of Data Analytics
5x
Faster Dashboard Interactions
60+
Predefined Dashboards Launched
90%
of Non-Technical Users Onboarded


