

.svg)
Advanced Google Heat Map
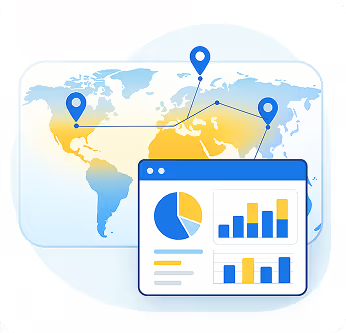
Plot measures on Google Maps Overview with this tool for visualizing your data points on Google Maps
Overview
- Introducing Paldi's Advanced Google Heat Maps - a tool for visualizing your data points on Google Maps.
- This innovative plugin offers a comprehensive heatmap highlighting areas with a higher concentration of data points, enabling you to easily spot patterns and trends in your data.
- With the ability to seamlessly switch between Google Maps' standard and satellite view you have complete control over the display of your data.
- Our tool offers a range of customization options, including the ability to modify the legend or marker shape, ensuring that your data is presented exactly how you want it.
- Additionally, features such as label text, auto-zoom, default zoom, and map center are available as well.
- Experience the power of Paldi's Advanced Google Heat Maps and take your data visualization to the next level.
Google Heat Map Widget
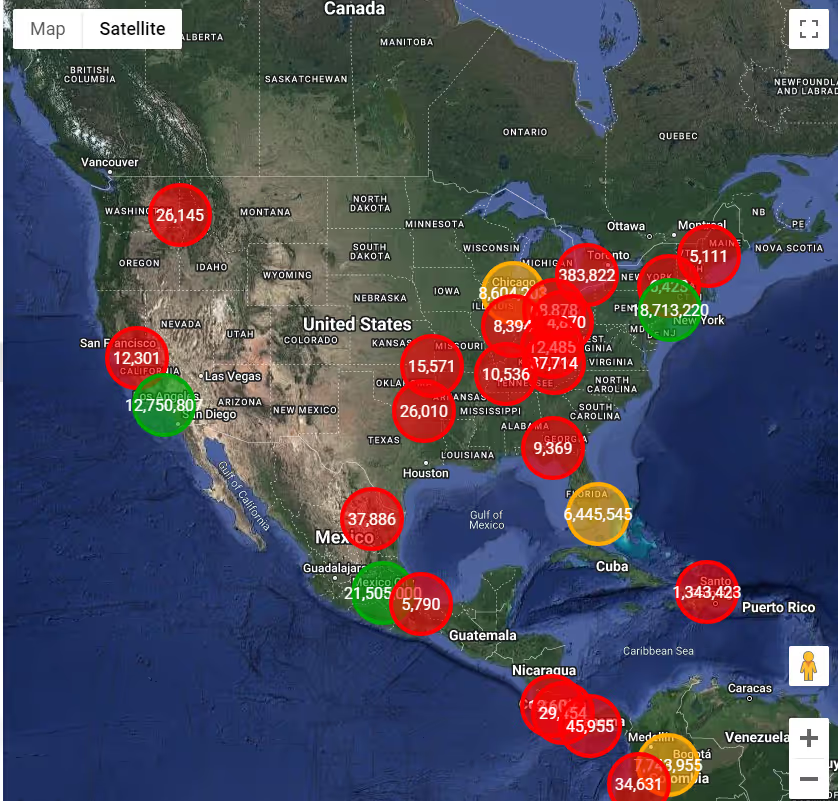

See this plugin in action
Get a personalized demo and discover how PALDI Solutions can transform your Sisense dashboards.
Book a free demo
Browse 70+ Certified Add-Ons
Go to Sisense Add-ons MarketplaceGo to Sisense Add-ons Marketplace
Enhance your Sisense Experience With our Top Rated Reporting Suite
Clients who use these with the Exports Enhancements
see faster adoption, richer insights, and greater ROI.
see faster adoption, richer insights, and greater ROI.


Flexi BloX
Build rich, custom layouts in Sisense dashboards with drag-and-drop control — no code needed
Best Seller

Advanced Table With Aggregation
Discover a vast array of powerful new capabilities to help elevate your tables to the next level!
Best Seller

Advanced Expandable Pivot Table
Get maximum analytics capabilities with Paldi’s Expandable Pivot plugin.
Best Seller

Leave the implementation to us.
"With the help of Paldi Plugins, you can just click and it’s there.
We were able to leverage Sisense to create a better user experience from a designer and user perspective."

HAMZA
/ Head of Data Analytics
5x
Faster Dashboard Interactions
60+
Predefined Dashboards Launched
90%
of Non-Technical Users Onboarded


