

.svg)
Pivot2 UI Enhancements
Uplift your Pivot2 widgets with new & exciting UI features.
Uplift your Pivot2 widgets with new & exciting features.
Take Pivot’s UX/UI to a new level, using Paldi Solutions’s Pivot2 UI Enhancements plugin which offers cutting edge infographics and UI elements.
Add visual representation to your measures. Allow users to see the bigger picture at a glance, recognize trends, and notice anomalies instantly.
Features list:
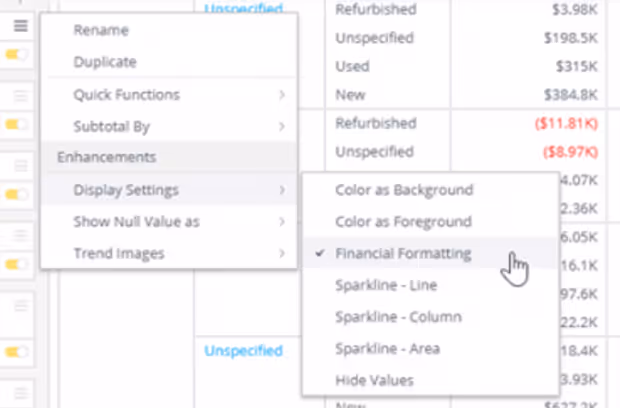
- Financial Formatting: Adjust pivot tables to use standard financial formatting of numbers. Show negative numbers colored in RED with parentheses instead of a minus sign.
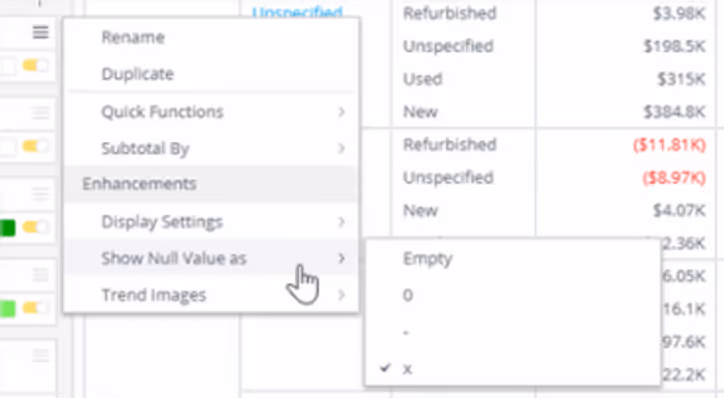
- Configure Null values representation: Display them as: 0, -, x, or empty cells.
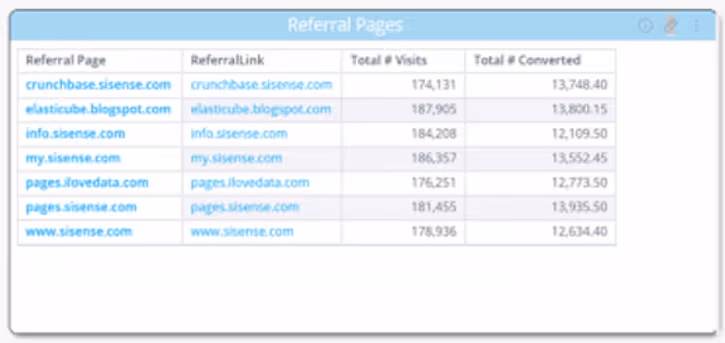
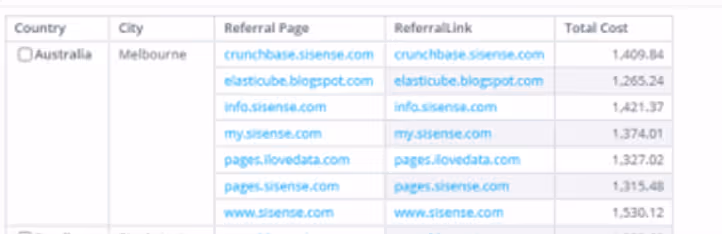
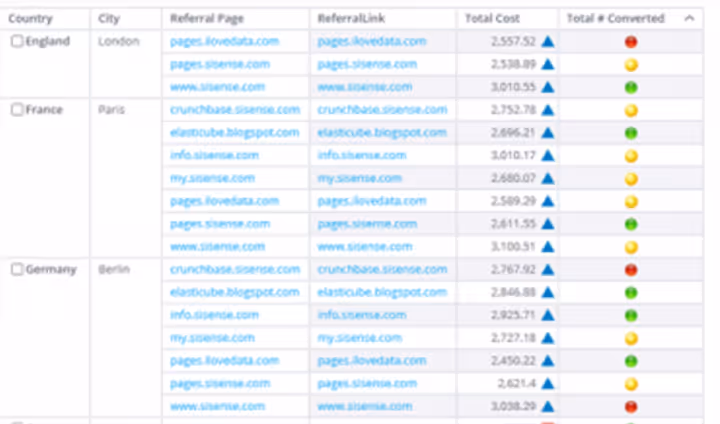
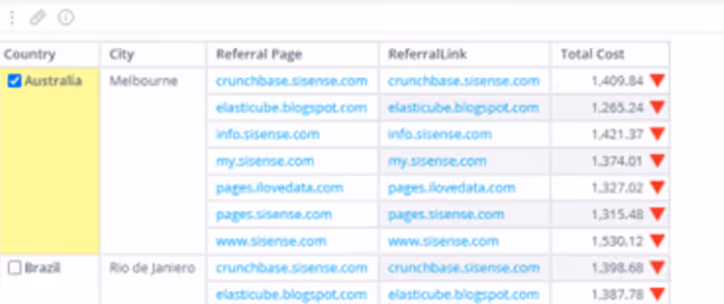
- Clickable URL Links: Modify URLs placed in rows of a pivot table into clickable links without adding any widget scripts.
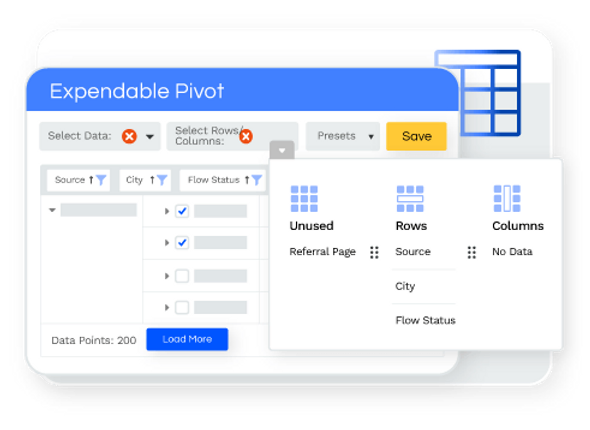
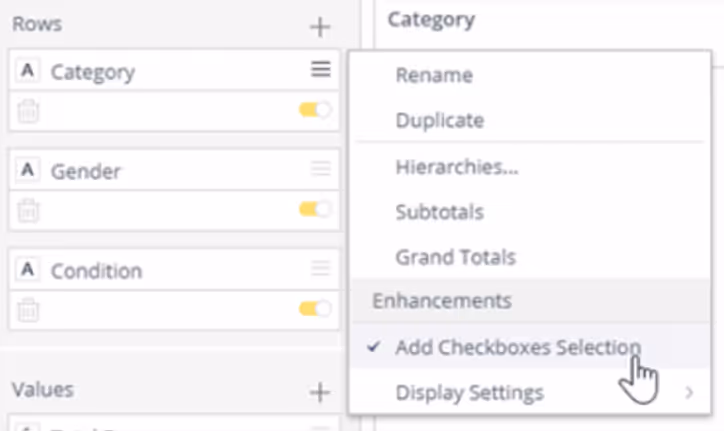
- Checkboxes: Add checkboxes to cells, and enable the user a quick way to make multiple selections. Very useful when using embedded dashboards and the filter panel is hidden.
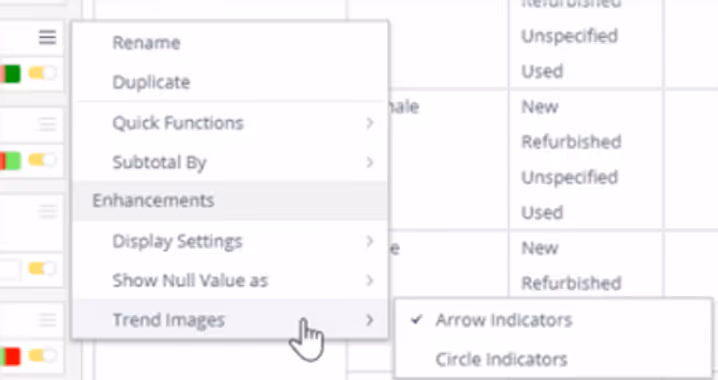
- Add Image Indicator (arrows & traffic lights) to measures: Assist the user to analyze trends in a glance by enabling comparison of values to a predefined threshold or to each other. - Configure thresholds using the plugin’s config file. - Ability to add a column to the pivot with only the indicator showing by turning on the indicators and then choosing “hide values” to hide the text.
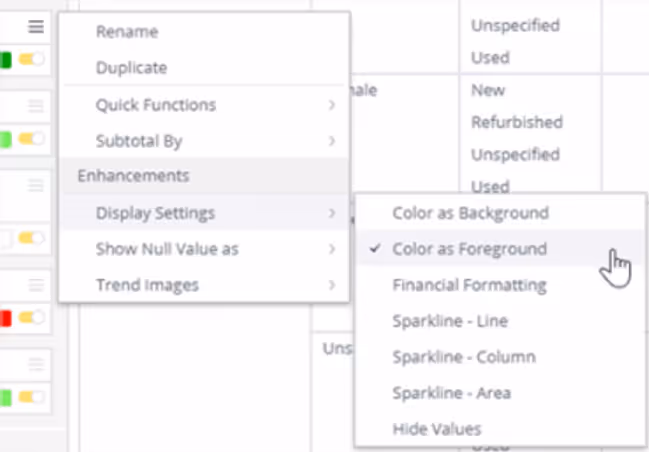
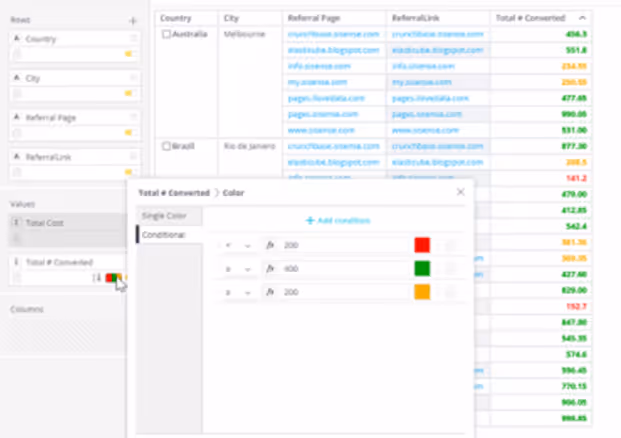
- Conditionally Color Pivot Foreground: Conditional foreground coloring allows you to apply the out of the box conditional coloring in Sisense on the foreground (text) rather than the background of the cell. Also, you can change the font weight to be bold.
- Sparklines Provides the option to create sparklines within a pivot table to show the progress of a measure over time in selected resolution
Financial Formatting
Null values representation:
Clickable URL Links:

Checkboxes
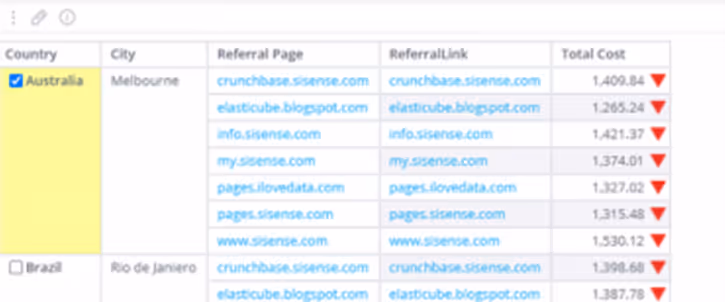
Add Image Indicator (arrows & traffic lights)
Conditionally Color Pivot Foreground
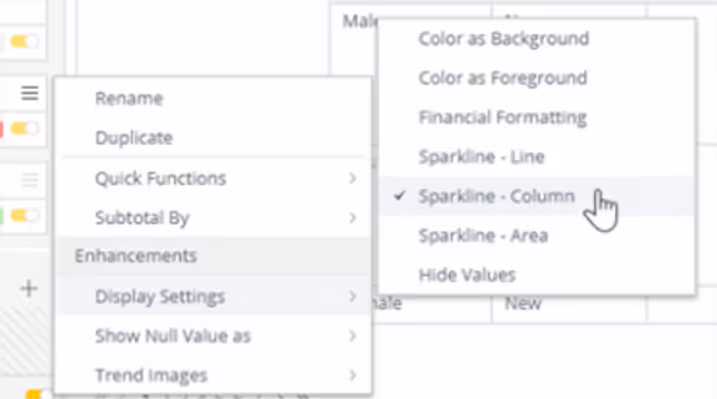
Sparklines


See this plugin in action
Get a personalized demo and discover how PALDI Solutions can transform your Sisense dashboards.
Book a free demo
Browse 70+ Certified Add-Ons
Go to Sisense Add-ons MarketplaceGo to Sisense Add-ons Marketplace
Enhance your Sisense Experience With our Top Rated Reporting Suite
Clients who use these with the Exports Enhancements
see faster adoption, richer insights, and greater ROI.
see faster adoption, richer insights, and greater ROI.


Flexi BloX
Build rich, custom layouts in Sisense dashboards with drag-and-drop control — no code needed
Best Seller

Advanced Table With Aggregation
Discover a vast array of powerful new capabilities to help elevate your tables to the next level!
Best Seller

Advanced Expandable Pivot Table
Get maximum analytics capabilities with Paldi’s Expandable Pivot plugin.
Best Seller

Leave the implementation to us.
"With the help of Paldi Plugins, you can just click and it’s there.
We were able to leverage Sisense to create a better user experience from a designer and user perspective."

HAMZA
/ Head of Data Analytics
5x
Faster Dashboard Interactions
60+
Predefined Dashboards Launched
90%
of Non-Technical Users Onboarded


