

.svg)
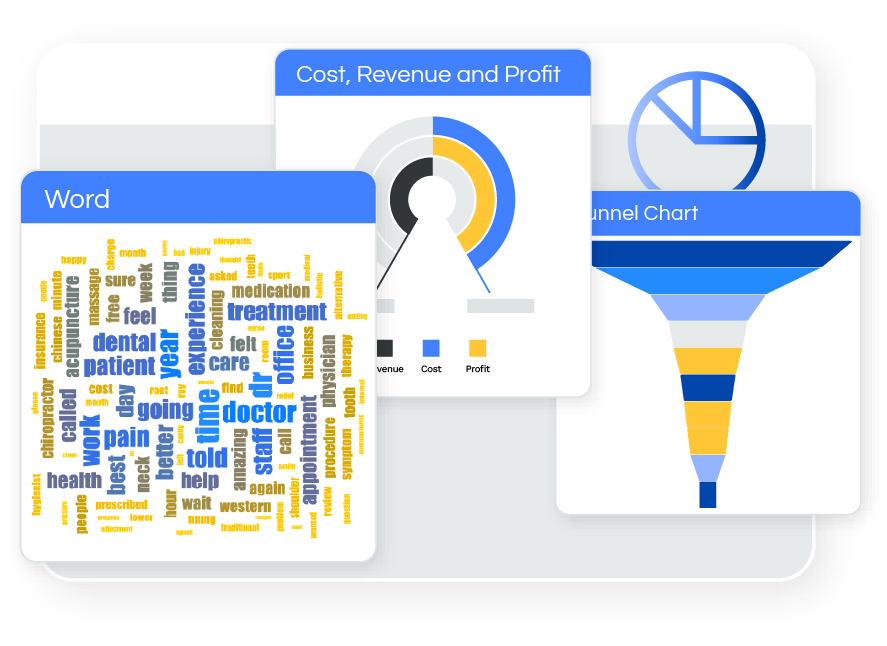
Adaptive Radial Infographics
Showcase complex relationships and compare multiple variables with dynamic radial graph
The "Adaptive Radial Infographics" plugin for Sisense empowers you to create stunning and highly customizable Radial Charts that bring your data to life. It represents data in a circular manner, with multiple data points radiating outward from a central point or inward to center based on user selection.
Key Highlights & Features:
- Customizable Tooltip.
- Support for Additional Measures in Tooltip.
- Extensive Customization Options.
- Zoom-in & Zoom-out functionality.
- Drill into category.
- Enables visual representation of correlation between two dimensions.
See in Action:
Contact us for a live demo and immediate free trial!
Simply send a request to inquiries@paldi.solutions

See this plugin in action
Get a personalized demo and discover how PALDI Solutions can transform your Sisense dashboards.
Book a free demo
Browse 70+ Certified Add-Ons
Go to Sisense Add-ons MarketplaceGo to Sisense Add-ons Marketplace
Enhance your Sisense Experience With our Top Rated Reporting Suite
Clients who use these with the Exports Enhancements
see faster adoption, richer insights, and greater ROI.
see faster adoption, richer insights, and greater ROI.


Flexi BloX
Build rich, custom layouts in Sisense dashboards with drag-and-drop control — no code needed
Best Seller

Advanced Table With Aggregation
Discover a vast array of powerful new capabilities to help elevate your tables to the next level!
Best Seller

Advanced Expandable Pivot Table
Get maximum analytics capabilities with Paldi’s Expandable Pivot plugin.
Best Seller

Leave the implementation to us.
"With the help of Paldi Plugins, you can just click and it’s there.
We were able to leverage Sisense to create a better user experience from a designer and user perspective."

HAMZA
/ Head of Data Analytics
5x
Faster Dashboard Interactions
60+
Predefined Dashboards Launched
90%
of Non-Technical Users Onboarded


