

.svg)
Arc Diagram
Map data relationships at a glance with the Arc Diagram Visualization.
Allow users to easily explore connections, dependencies, and clusters across complex datasets through an intuitive, curved layout.
Ideal for risk analysis, system mapping, and customer journeys, the Arc Diagram is optimized for advanced embedded environments.
Unlock the full power of advanced analytics with Paldi's Advanced Visualization Package — a curated suite of high-impact, embedded-ready visualizations

Key Highlights & Features:
- Uncover hidden patterns with an intuitive arc layout.
- Hover and highlight connections.
- Fully customizable design for nodes, arcs, colors, and labels.
- Optimized for seamless integration with Sisense Compose SDK (CSDK) environments.
- Fast performance on large datasets.
Popular Use cases:
- System Architecture Mapping: Uncover hidden dependencies across systems and platforms.
- Customer Journey Mapping: Track user flows and interaction points effortlessly.
- Fraud Detection: Spot unusual relationships and hidden networks within transactions.
- Communication Networks: Map connections between teams, departments, or users.
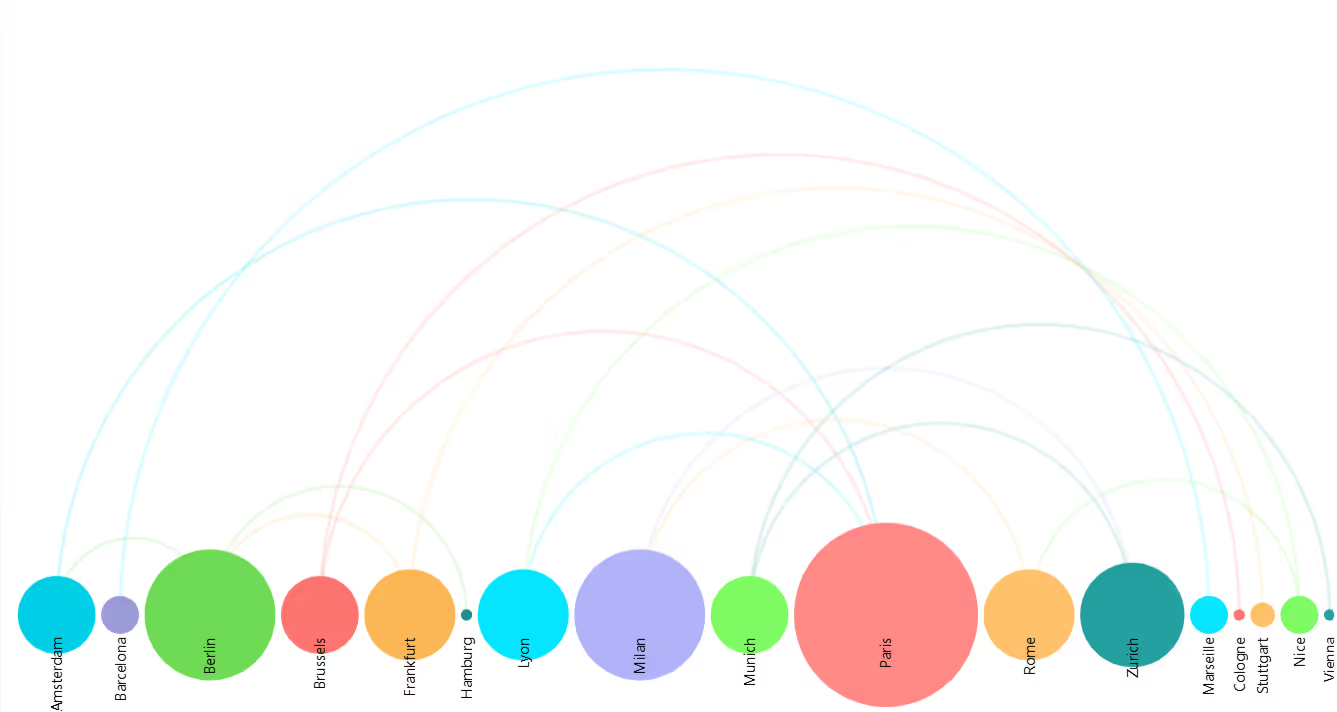
Horizontal Arc Diagram Widget:
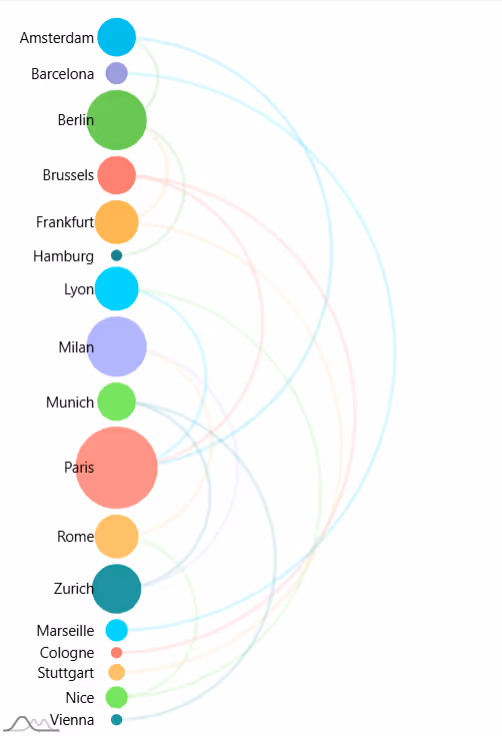
Vertical Arc Diagram Widget:
Contact us for a live demo and immediate free trial!
Simply send a request to inquiries@paldi.solutions


Enhance your Sisense Experience With our Top Rated Reporting Suite
see faster adoption, richer insights, and greater ROI.


"With the help of Paldi Plugins, you can just click and it’s there.
We were able to leverage Sisense to create a better user experience from a designer and user perspective."


