

.svg)
Empower Users with Filtering, Bookmarks & Personalization
No-Code Customization
UX Enhancements
A suite of tools that empowers users with intuitive self-service, flexible filtering, custom styling, and optimized performance — all wrapped in an accessible, modern dashboard experience.
Book a demo
Need help with
UX Enhancements
?

Other Tips & Guides
Browse ResourcesAll Plugins in the
UX Enhancements
Suite
Dynamic Custom Fields
- Show each customer only the custom fields they actually use.
- Replace placeholder columns with real customer-specific names.
- Keep a single shared schema while delivering a personalized Sisense experience.
- Automatically update Sisense when customers add new custom fields.
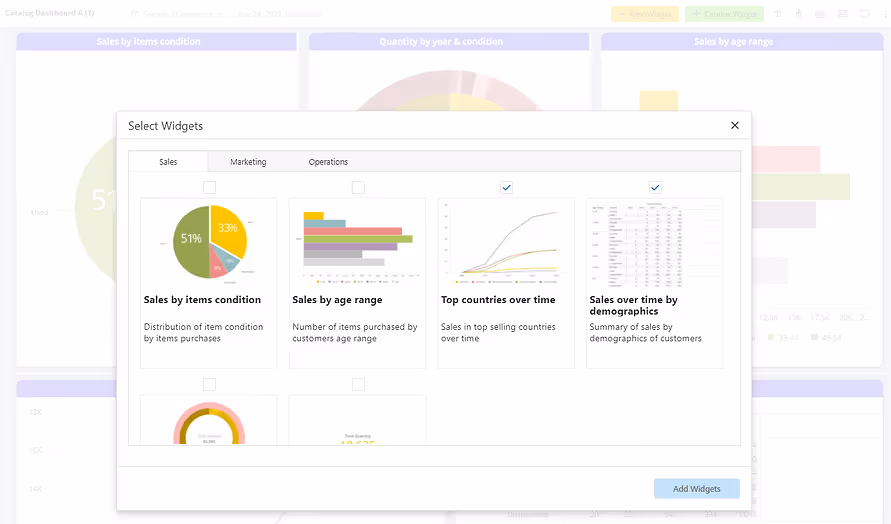
Viewers Dashboard
- Allow viewers to build their own dashboards; Make “True self-service BI” more than a slogan.
- Involve users in dashboards design to increase retention.
- Enhance Viewers’ capabilities in building dashboards with an easy drag & drop UI.
- Can be used as a monetization strategy differentiating your platform from competitors.
- Have viewers tell a story with their own data.
Save precious time for your developers and leave the dashboard design for your viewers.
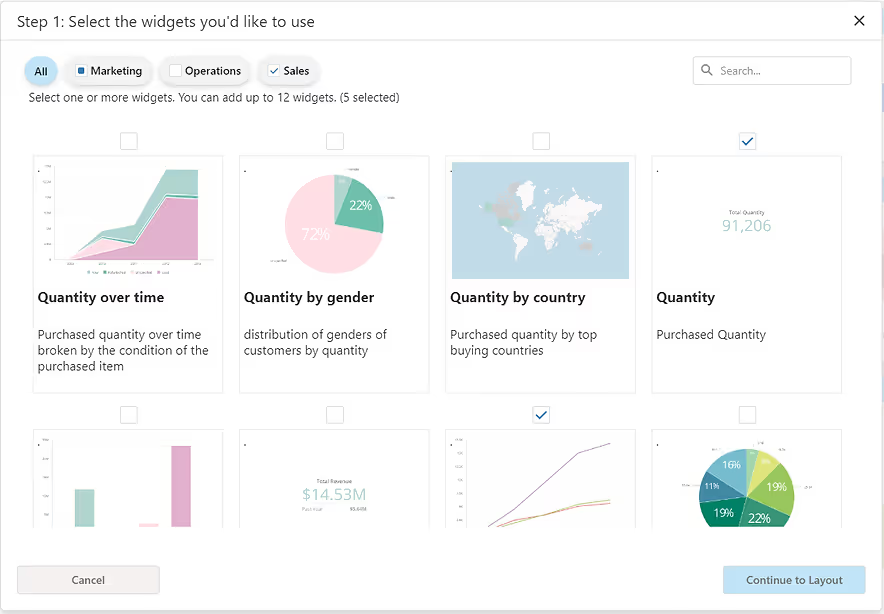
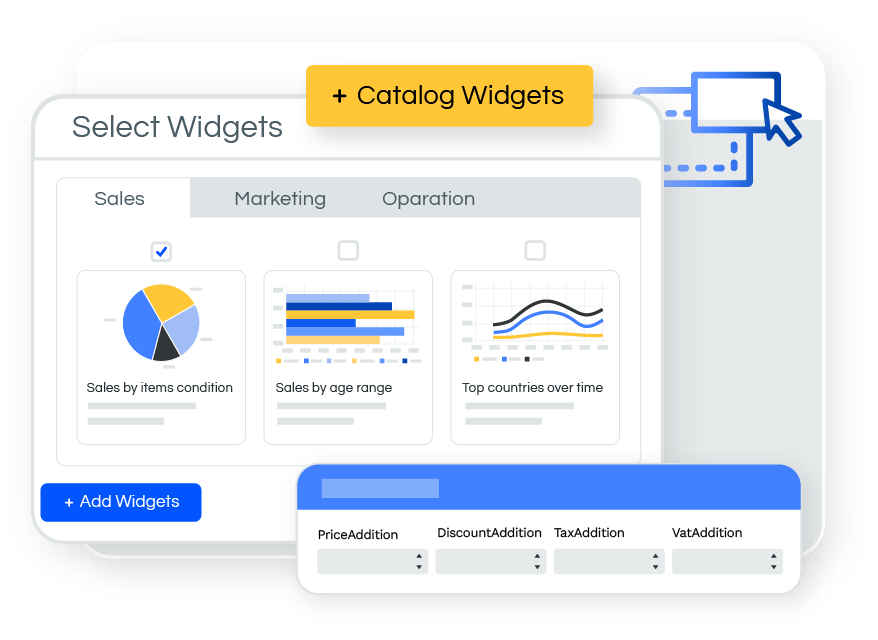
Widgets Catalog
- Empower Users to build dashboards using a set of predefined widgets.
- Build unique catalogs for specific analytical use cases.
- Simple drag & drop dashboard creation via widget selection dialogue.
- Create widgets with preset formulas and make the process easy and code-free for users.
Viewer Dashboard 2.0
Paldi’s “ Viewers Dashboard” lets you supercharge your viewers with true self-service BI, letting them design their own dashboards!
With this plugin, all you will need is to :
- Create a single Viewers Dashboard widget
- Embed it as a standalone page within your application
- Let viewers create and manage their own dashboards effortlessly.
- Keep utilizing any Sisense built-in feature like data security, filters, AI etc’
Widget Script Manager
- Enjoy the benefits of a plugin while keeping the flexibility of the widget scripts.
- Save time on developing and deploying your widget scripts.
- Prevent widget scripts discrepancies between dashboards.
- Can be easily integrated within your Git repository.
_PNG.avif)
Tree Filter
- Expand and collapse data nodes.
- Excel-like Search & Select functionality.
- Single-Selection vs Multi-Selection.
- Option to use different dependency modules between filters.
- Null values handling.
- Custom selection label.
- Customize the style and layout of the dropdowns and buttons.

Pivot2 UI Enhancements
- Special Financial Formatting
- Configure Null values representation.
- Clickable URL Links!
- New In-cell customizations: Sparklines, checkboxes, and conditional formatting
- Add Image Indicator (arrows & traffic lights) to measures.

Time Zone Adjustments
- Get all your users on the same page with accurate data fitting their own time zones.
- Prevent your users from consuming wrong data and drawing bad conclusions.
- Supports all the relative date time filters with ranges (last month, last 7 days, etc.).
- Supports all filter types.
- Supports multiple users, in multiple locations.
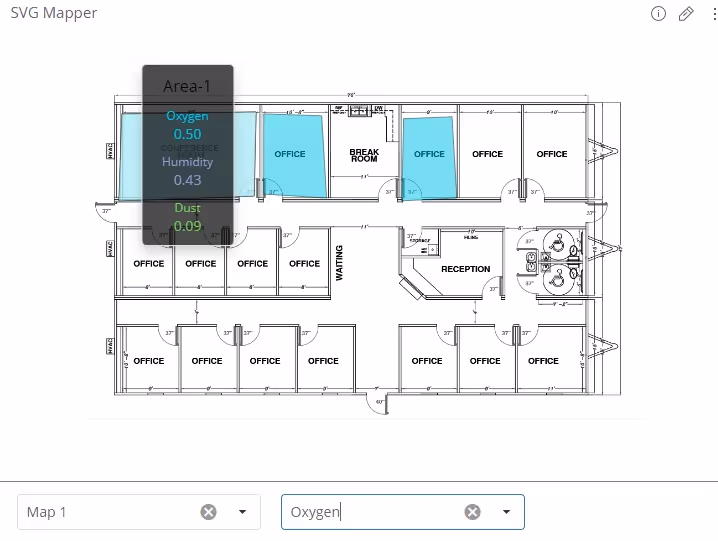
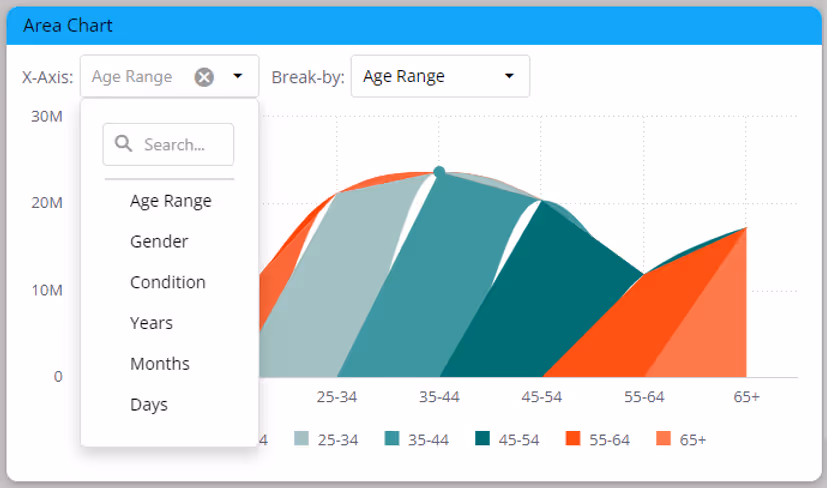
SVG Mapper And Shapes Builder
- Create interactive maps by drawing custom shapes and mapping data onto SVG formats in Sisense.
- Export all layers to PowerPoint, with each layer as an individual slide.
- Plot multiple measurements per layer for comprehensive insights.
- Utilize interactive click-to-filter features and detailed tooltips for enhanced data exploration.
- Combine multiple data points and locations with multi-layer and multi-measurement.

Pulse Enhancements
- Easily navigate Pulse alerts by filtering dashboards in a structured folder view.
- Quickly find alert sources without manually searching through dashboards.
Query Optimizer
- The most efficient tool on the market for optimizing user queries.
- Up to a 75% reduction in processing time.
- Processing time won’t be affected by the amount of filters or the complexity of the data model.
- This plugin will massively reduce your server costs by saving on computing resources..
Lazy Loading
- Only widgets that are shown in the dashboard will send a query.
- Reduce costs and get an immediate ROI.
- Best for databases such as: Athena, RedShift, BigQuery, Data Bricks, Snowflake, and Azure.
- boost performance for every data source (ElastiCube\Live model).
- The performance boost is even more noticeable when the dashboard has Tabber or Accordion.
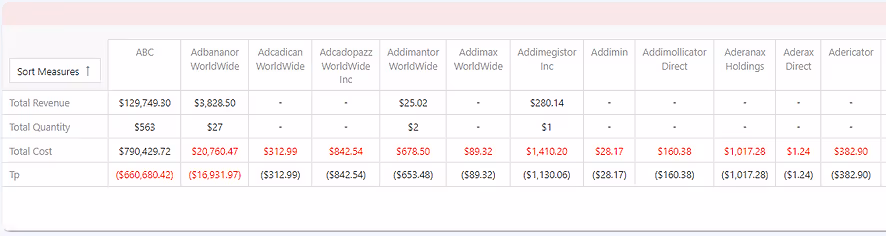
Financial Table
- Easily unpivots the data.
- Measures sorting.
- Conditional formatting.
- Financial formating.
- Configure null values representation.
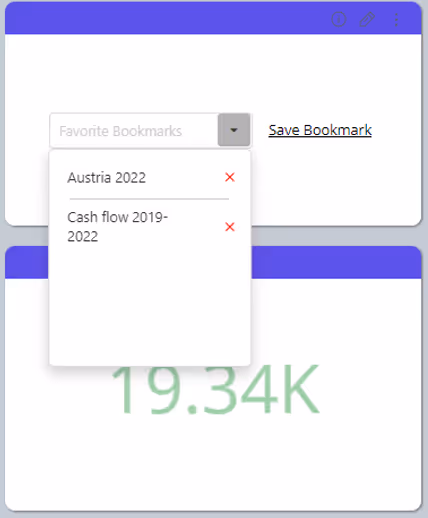
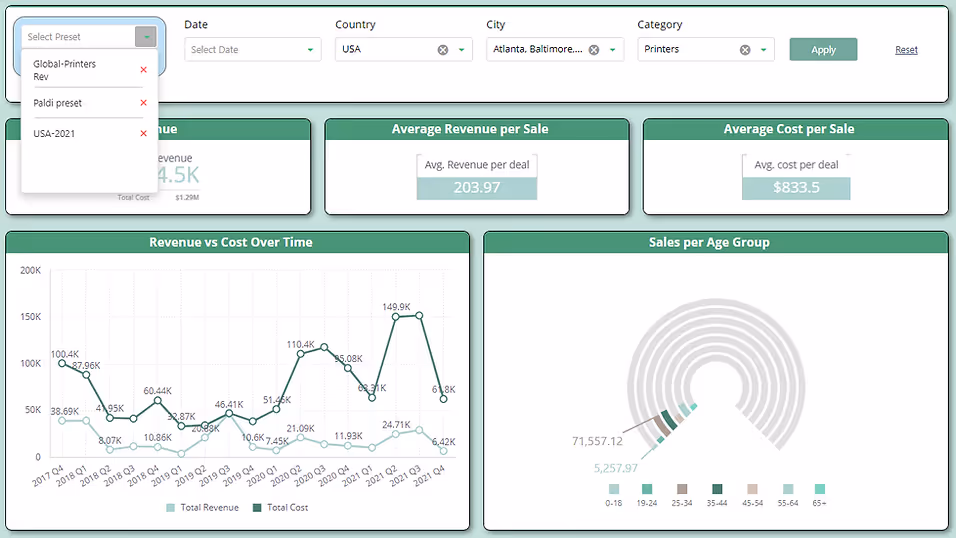
Filters Bookmarks
- Easily set your favorite values selection for each analysis you would like to perform.
- Predefine filters and save them as bookmarks.
- Bookmark sorting.
- Manual dropdown sorting
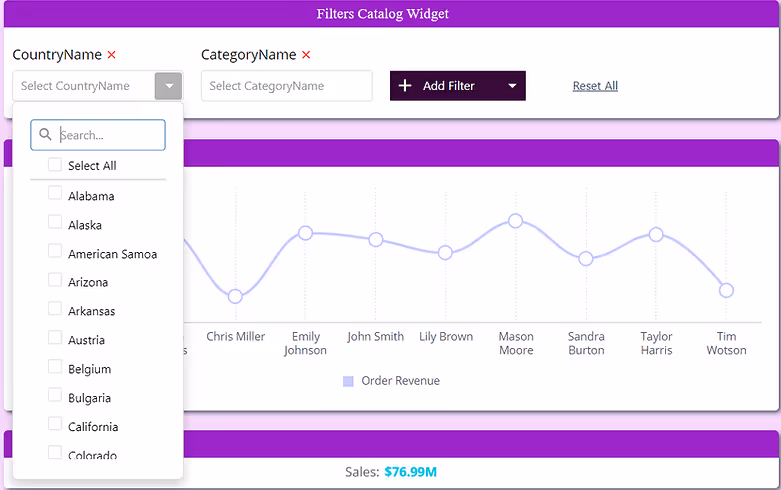
Filters Catalog
- Allow Viewers to select their filters from a predefined list of filters.
- Highly interactive, dynamic and responsive dropdown filters widget.
- Special behavior within PDF Exports.
- Works great with high cardinality dimensions (even millions of values).
Field Analyzer
- Save the time on searching fields within your dashboards\widgets\measures.
- Prevents widget and dashboard errors when editing your data source and cube.
- Intuitive dialog with calls to action on each field appearance.
- Features a “Jump to” action for quick edit.
Field Replacer
- Replace any column or table without changing anything in the dashboards.
- Can be deployed as part of your CI/CD pipeline and Git repository.
- Prevent widgets and dashboards error when editing your data source and cube.
- Works with ALL possible formula functions.
- Help your designers by creating dynamic dashboards in terms of data source changes.
- Quick solution for “fatal” mistakes in your data source.
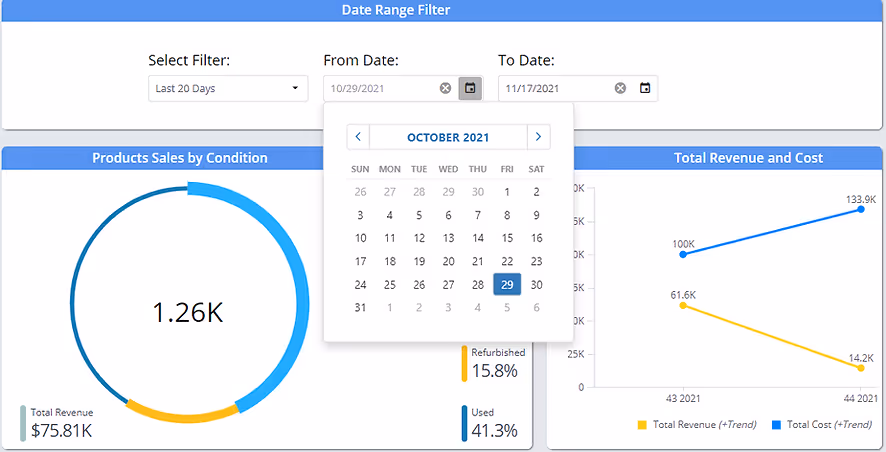
Date Range Filter
- Interactive "From" and "To" calendar date pickers.
- Easily define the filter presets.
- Configure a default filter selection that will be set whenever you open the dashboard, for all users.
- Hide the predefined Filters list if it's not needed.
- Create more than one date filter (for different date fields) in the same dashboard.
Dashboard Styler
- Uplift your dashboards’ look & feel with a few clicks and get the pixel-perfect design you were looking for - no coding is required!
- Let your designers customize their dashboards’ design with a simple and intuitive UI while boosting their User Experience.
- Easily save different styles as themes and apply them with a single click on a dashboard
- Designed for OEM and embedded use, this plugin adapts to your style guide and elevates your dashboard with modern, limitless customization.
- All widget types are supported
Dashboard Sharing Utility
- Ability to share full or partial folders with one action.
- Easily change the dashboard ownership of multiple dashboards.
- Prevents sharing discrepancies between dashboards.
- Avoid duplicating unnecessary folders/dashboards.
.avif)
Control Table Columns
- Optimized for use cases with a large number of columns.
- Built-in performance booster for heavy dashboards.
- Supports all table widgets.
- Comes with styling and customization options.
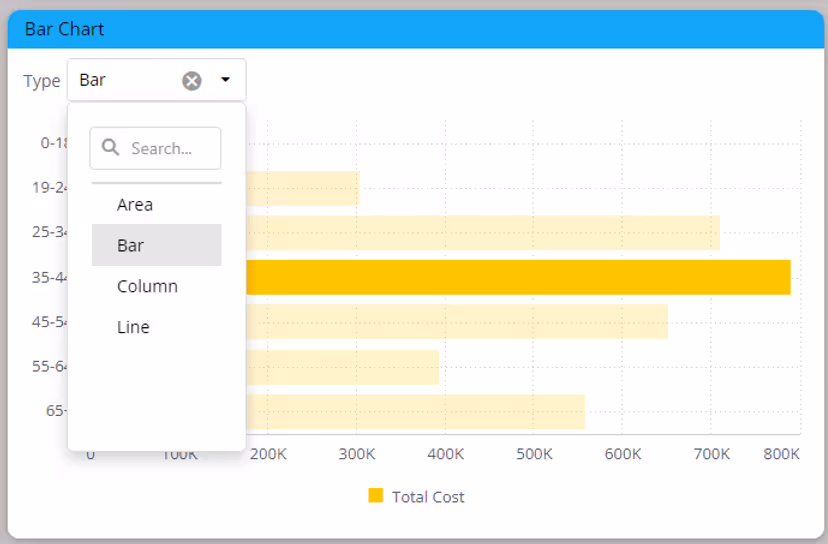
Chart Type Switcher
- Easily switch between different chart types on any dashboard and save precious dashboard real-estate.
- Helps to reduce the number of widgets on users’ dashboards.
- A strong selling point for OEM deployments.
- Supports all Sisense chart capabilities.
- No need for a sophisticated configuration file.
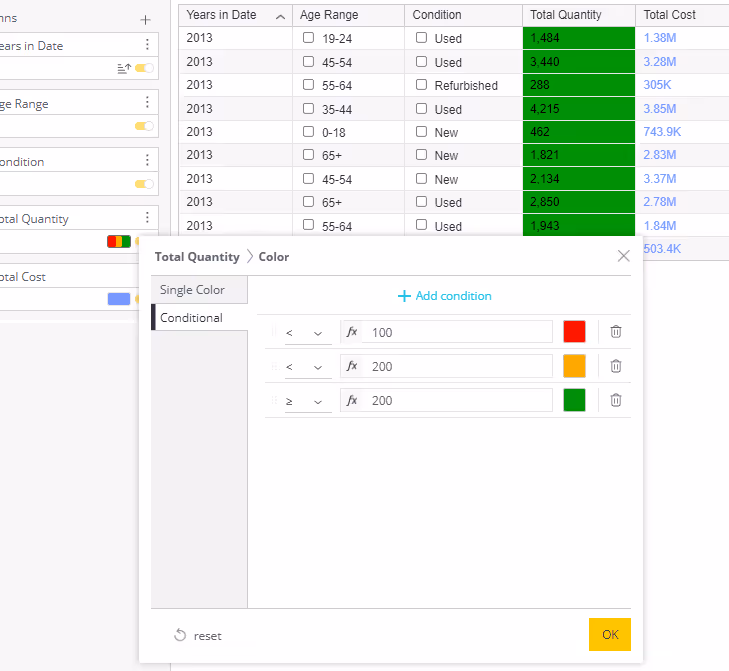
Aggregated Table Enhancements
- Checkbox filtering!
- Conditional formatting!
- Apply and Reset filters buttons, for improved UI.
- Advanced Jump-To-Dashboard.
- Built to increase dashboard performance and reporting speed.
Advanced Measure Changer
- Dynamically switch between measures in widgets.
- Completely managed in the dashboard - With zero code approach.
- Performance booster for heavy dashboards.
- Supports all existing charts capabilities.
- Compatible with all Sisense charts.
- Perfectly Integrates with and complements the “Advanced Dim Switcher” plugin.
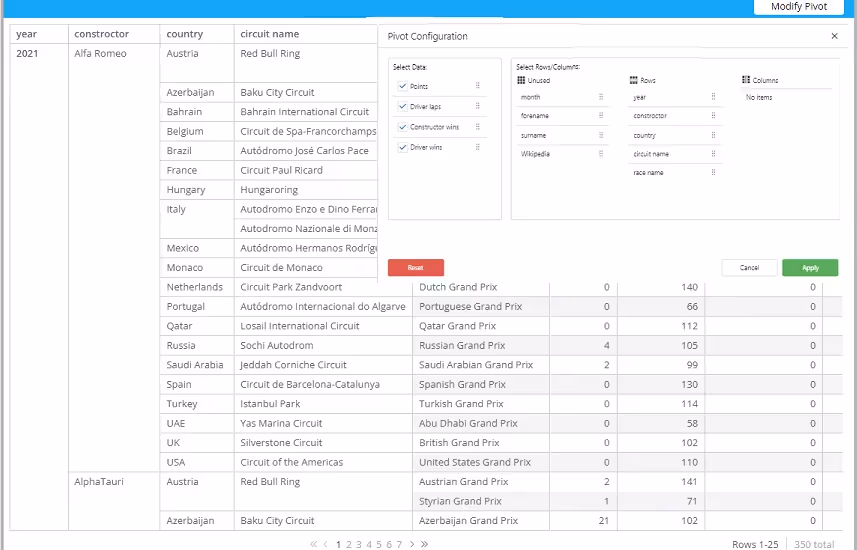
Advanced Pivot Toolbar
- Allow viewers to build their own pivot views.
- Made to boost performance on heavy dashboards.
- Integrated with out-of-the-box Sisense native pivot tables.
- Fully customize the style of the pivot header.
- Limit the number of controlled measures and dimensions.
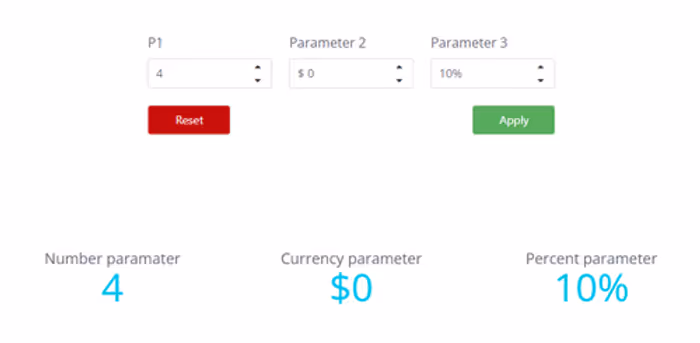
Advanced Input Parameters
- Increased adoption with powerful interactive dashboards.
- Intuitive on the fly What-If analysis.
- Completely dynamic and managed in the dashboard - no need for any data model change.
- Seamlessly interact with your data using Parameter Inputs.
- Works with ALL possible formula functions.
Advanced Filters
- Option to lazy load values when the dimensions are very big.
- Fully customize the style and layout of the dropdowns from the design panel.
- Fully customize Apply/Reset buttons.
- Viewers can define and save filters selection to their favorite selections (data segmentation/preset).
- Option to use different dependency modules between filters.
Advanced Dim Switcher
- Dynamically switch between dimensions in widgets.
- Completely managed in the dashboard - Zero code approach.
- Performance booster for heavy dashboards.
- Supports all existing charts capabilities.
- Compatible with all Sisense visualization charts.

Action Table - Secured Writeback
- Effortlessly write back data points directly into your SaaS database.
- Fully compatible with top platforms like Amazon Redshift, Snowflake, Databricks, Google BigQuery, and more.
- Ensure secure writeback to maintain data integrity and compliance.
- Leverage accessible API endpoints for advanced custom actions and seamless integrations.
- Empower self-service BI by enabling viewers to collaborate directly within Sisense dashboards.
Adaptive Global Filters
- Easily maintain filter consistency across multiple dashboards with Sticky FIlters.
- Enable or disable global filters for each individual dashboard as needed.
- Makes navigating between dashboards a smoother experience.
Enhance your Sisense Experience With our Top Rated Reporting Suite
Clients who use these with the Exports Enhancements see faster adoption, richer insights, and greater ROI.


Flexi BloX
Build rich, custom layouts in Sisense dashboards with drag-and-drop control — no code needed
Best Seller

Advanced Table With Aggregation
Discover a vast array of powerful new capabilities to help elevate your tables to the next level!
Best Seller

Advanced Expandable Pivot Table
Get maximum analytics capabilities with Paldi’s Expandable Pivot plugin.
Best Seller
Need help with
UX Enhancements
?


