

.svg)
Tree Diagram
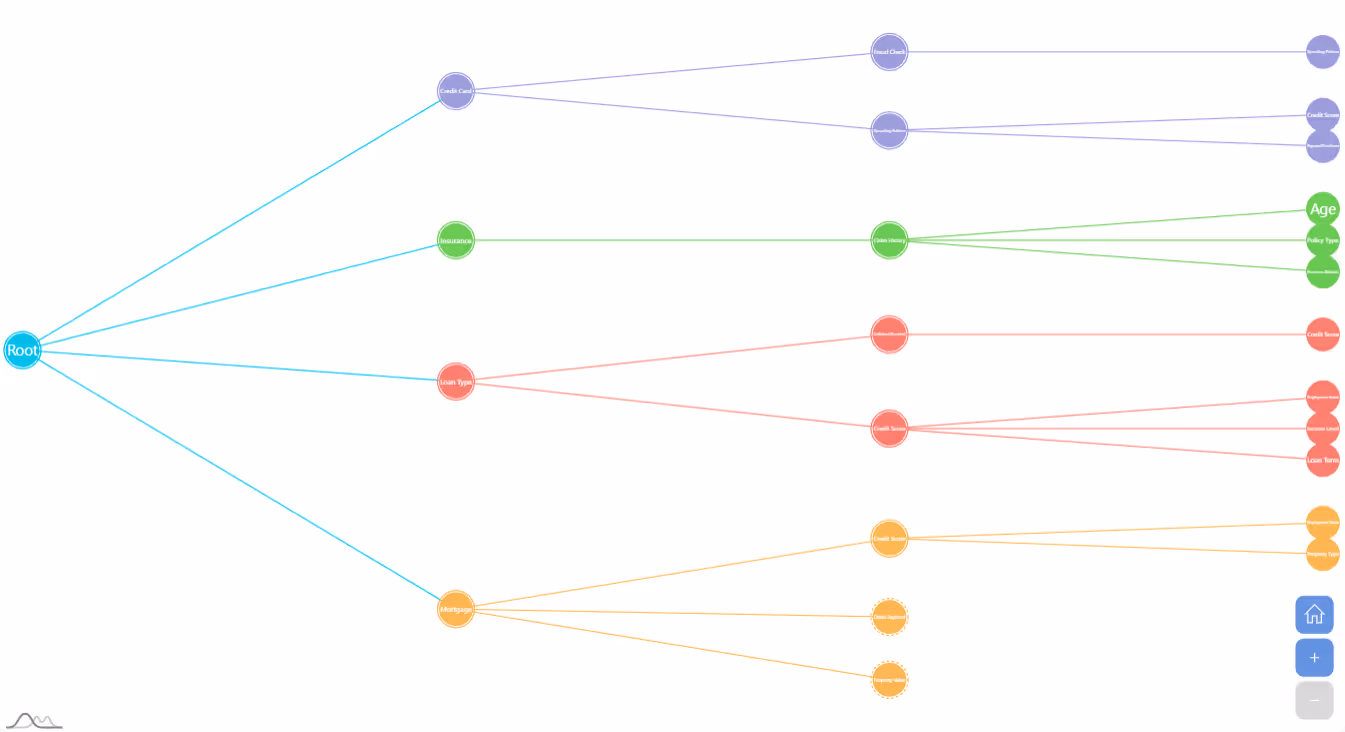
Visualize decision paths, hierarchies, and classification processes at a glance with the Tree Diagram Visualization.
Allow users to easily explore multi-level structures, decision points, and outcomes across complex datasets through an intuitive, branching layout.
Ideal for risk assessment, customer segmentation, and process mapping, the Tree Diagram is optimized for advanced embedded environments, offering a clear way to navigate layered information.
Unlock the full power of advanced analytics with Paldi's Advanced Visualization Package — a curated suite of high-impact, embedded-ready visualizations

Key Highlights & Features:
- Visualize multi-level decision structures
- Expand and collapse branches dynamically
- Fully customizable node styling and branching layout
- Optimized for seamless integration with Sisense Compose SDK (CSDK) dashboards
- Maintain fast, smooth performance across deeply nested data
Popular Use cases:
- Risk Assessment: Map how various inputs lead to different risk outcomes.
- Customer Segmentation: Visualize customer categories based on attributes or behaviors.
- Operational Decision Trees: Track business rules, decision points, and process flows.
- Predictive Modeling: Display classification models and probability paths.
- Training & Internal Communication: Explain complex workflows or organizational structures visually.
Vertical Tree Diagram Widget:

Horizontal Tree Diagram Widget:
Contact us for a live demo and immediate free trial!
Simply send a request to inquiries@paldi.solutions


Enhance your Sisense Experience With our Top Rated Reporting Suite
see faster adoption, richer insights, and greater ROI.


"With the help of Paldi Plugins, you can just click and it’s there.
We were able to leverage Sisense to create a better user experience from a designer and user perspective."


