

.svg)
Advanced Sankey Diagram
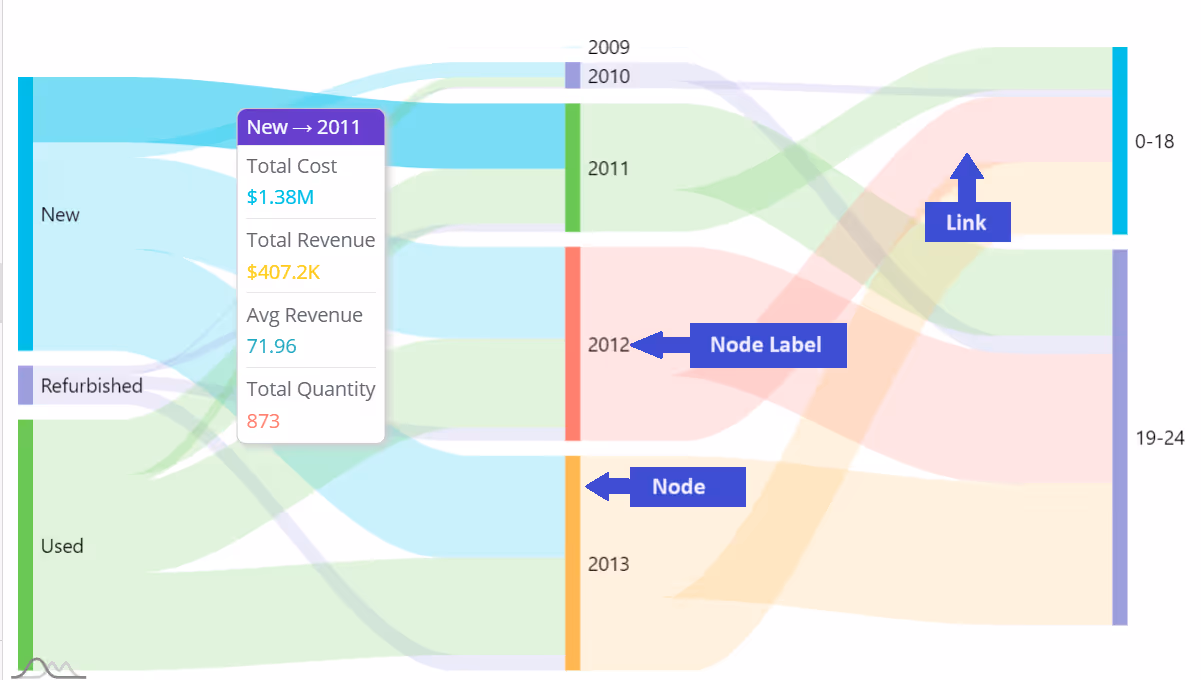
Paldi's "Advanced Sankey Diagram" plugin for Sisense empowers users to create multi-level Sankey diagrams, offering a versatile and insightful data visualization tool.
A Sankey diagram is an excellent choice for illustrating complex flows and relationships, making it perfect when you want to focus on a specific aspect or resource, such as energy, time, or money.
This plugin provides a wide range of features and settings to enhance your data storytelling, making it more engaging and informative.
Key Features:
- Multi-level diagram
- Tooltip information
- Design and styling
Sankey Diagram Widget:
Contact us for a live demo and immediate free trial!
Simply send a request to inquiries@paldi.solutions


Enhance your Sisense Experience With our Top Rated Reporting Suite
see faster adoption, richer insights, and greater ROI.


"With the help of Paldi Plugins, you can just click and it’s there.
We were able to leverage Sisense to create a better user experience from a designer and user perspective."


