

.svg)
Chart Type Switcher
Have you ever needed to visualize data with different chart types only to realize you are wasting dashboard space?
How often do viewers ask to visualize the same data in different ways?
With the Paldi “Chart Type Switcher” you will supercharge your viewers and let them decide how to visualize their data.
One widget - many charts.
With an intuitive dropdown menu, viewers will have the ability to make the data tell its own story in a way that matches their own unique needs. All while you save dashboard designers time and effort.

See it in Action:
Key Highlights
- A strong selling point for OEM deployments.
- Dynamic interface managed on dashboard - Zero code approach.
- Performance booster for heavy dashboards.
- Supports all existing charts capabilities.
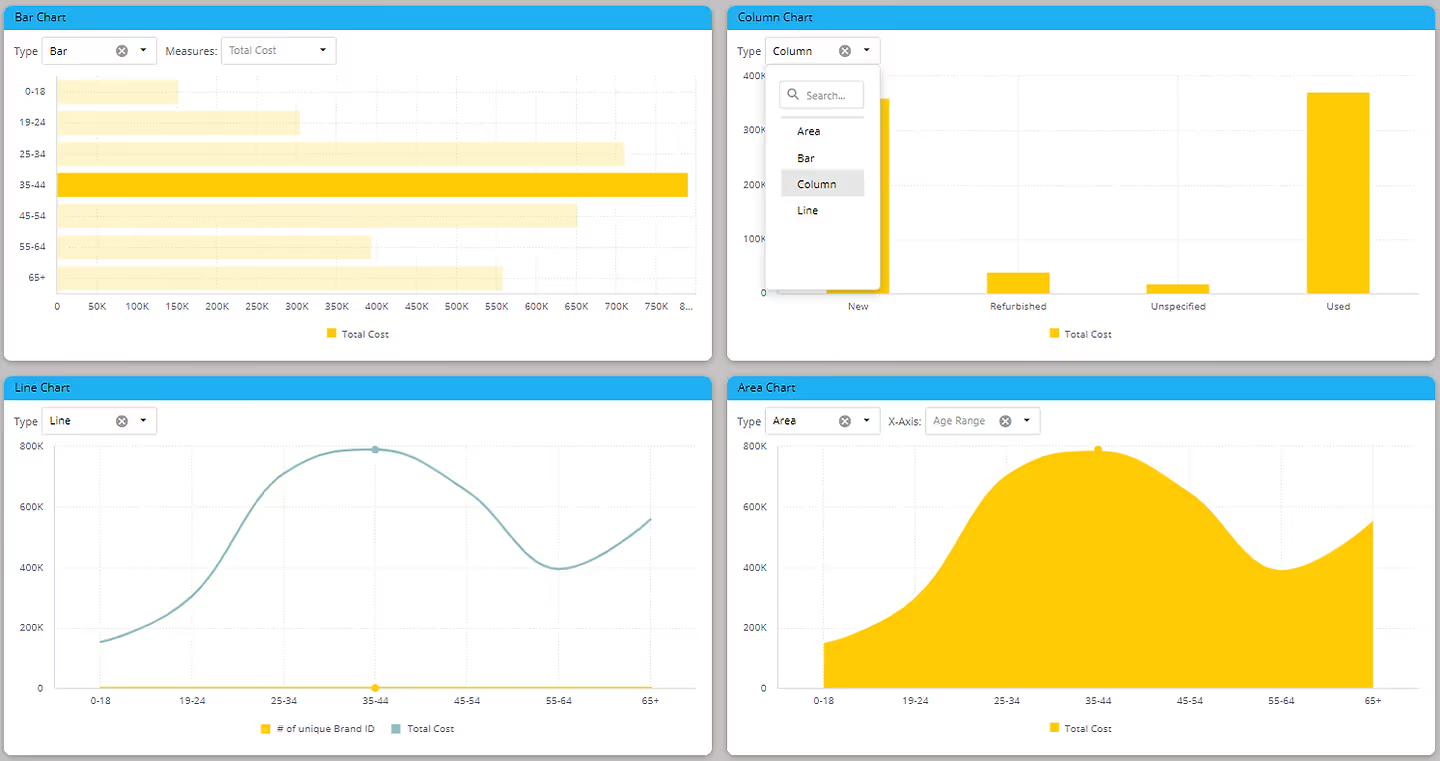
- The plugin supports column charts, bar charts, line charts and area charts.
- No need for a sophisticated configuration file.
Key Features
- An Intuitive drop-down menu.
- Easily managed within a dedicated widget.
- Full integration with Paldi’s:
- Advanced Dim switcher
- Advanced Measure changer
- Decide whether viewers selection is persistent or not
Chart Type Switcher widget:
Supported charts:


Enhance your Sisense Experience With our Top Rated Reporting Suite
see faster adoption, richer insights, and greater ROI.


"With the help of Paldi Plugins, you can just click and it’s there.
We were able to leverage Sisense to create a better user experience from a designer and user perspective."


