

.svg)
Presentation Builder (Google Slides)
A Google Slides add-on that helps you embed Sisense widgets into presentations and easily update them with a single click.
Presentation Builder is a tool that helps you embed Sisense widgets into presentations and update them upon demand with a single click.
With Presentation Builder you can:
- Easily add Sisense widgets as images directly from within your presentation.
- Refresh your presentation with up-to-date data in a single click.
- Change filters, click refresh, and produce a new presentation to a different client – in a single click.
- Choose a template from a library of presentation templates and populate them with your Sisense widgets.
- Create branded, personalized presentations based on individualized needs
- Reduce presentation building time by 90%
- Add KPI widgets as simple plain text within text boxes so you can style them the way you want.
- Easily view and use the underlying data behind your widgets.
- Resize your images to the specific size you need them to be without stretching them or modifying their size in their source dashboard.
- Supports Data Security
- Viewers can define their own report
- Have our own designers & Sisense experts building your first report for you!
Future Developments:
- Presentation Builder Email Reports tool which is a service that lets you easily use your Presentations Builder as PDF Email Reports and automatically distribute them to your users.
See it in action:
How Does it Work?
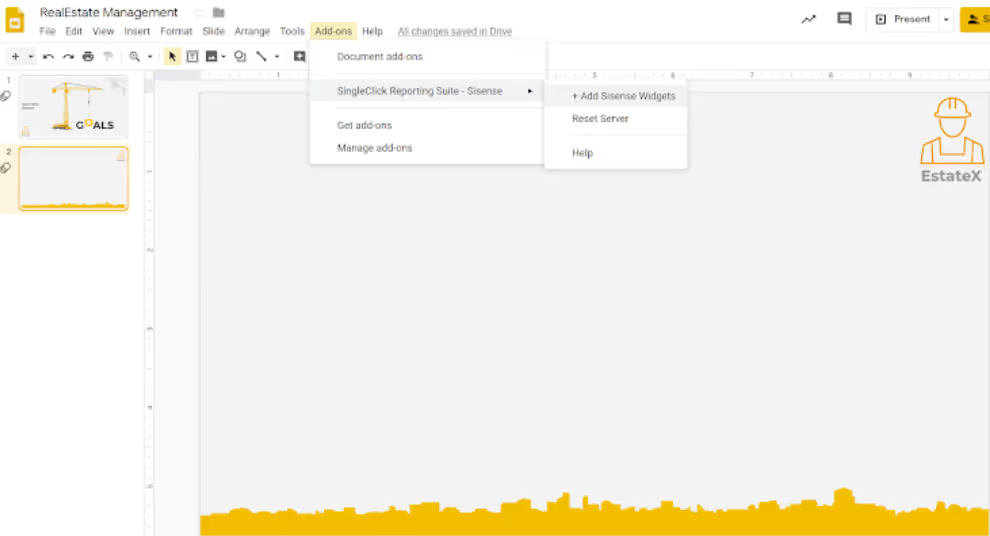
1. Open Presentation Builder Add On:
2. Easily navigate across the dashboards & widgets and choose which to add to your presentation:
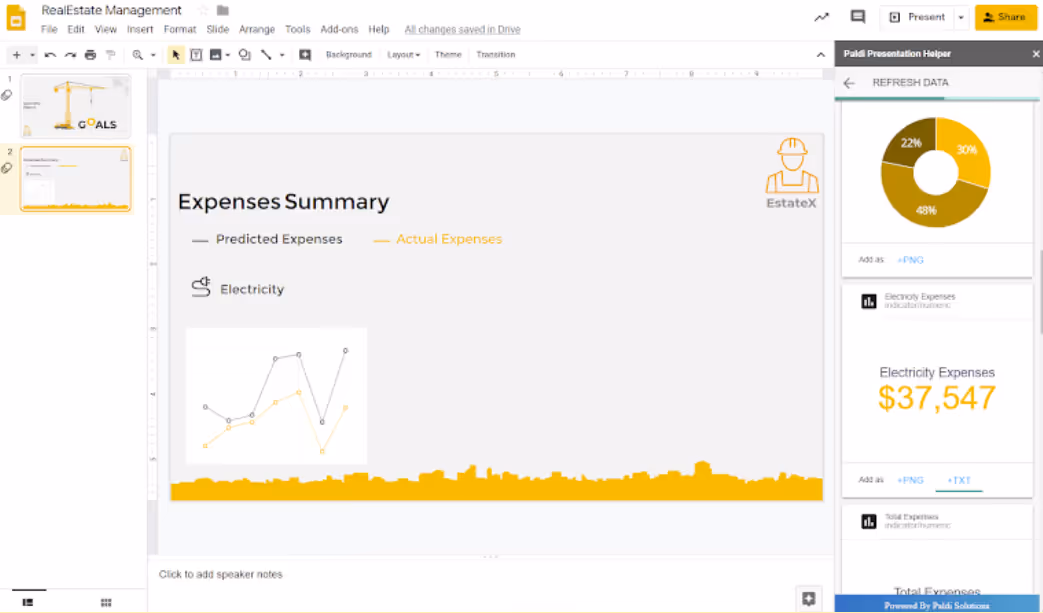
3. Indicators can be added as PNG or as plain TXT:
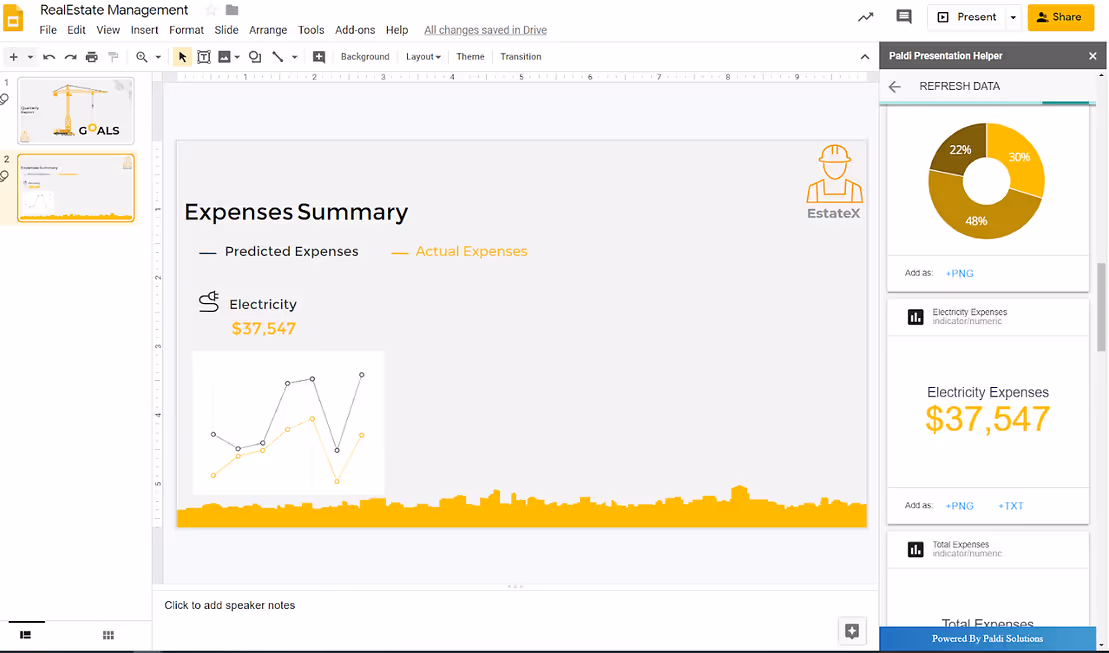
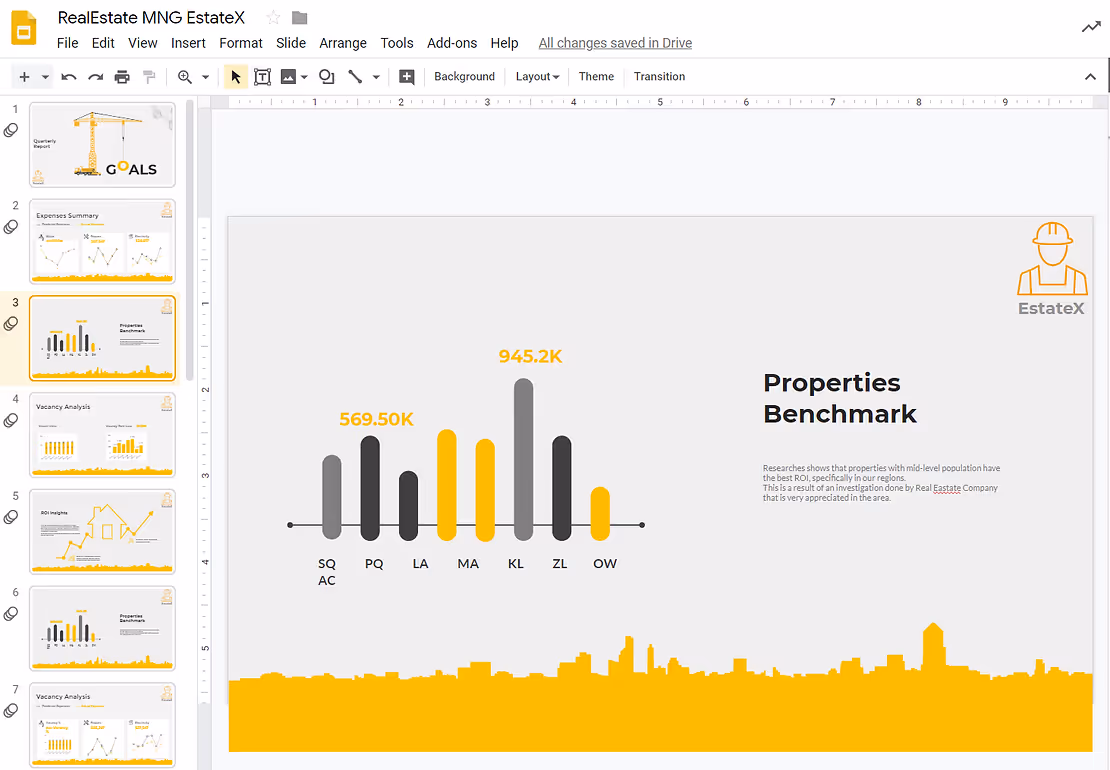
4. Keep editing your presentation:

And now for the really cool stuff 🙂
- Few hours passed by, data has changed and you want to update your presentation? Simply click on Refresh Data and the results will be updated 🙂
- Want to generate the same presentation but for a different customer?
- Want to play with filters and see the results?
5. Change the dashboard filter selection
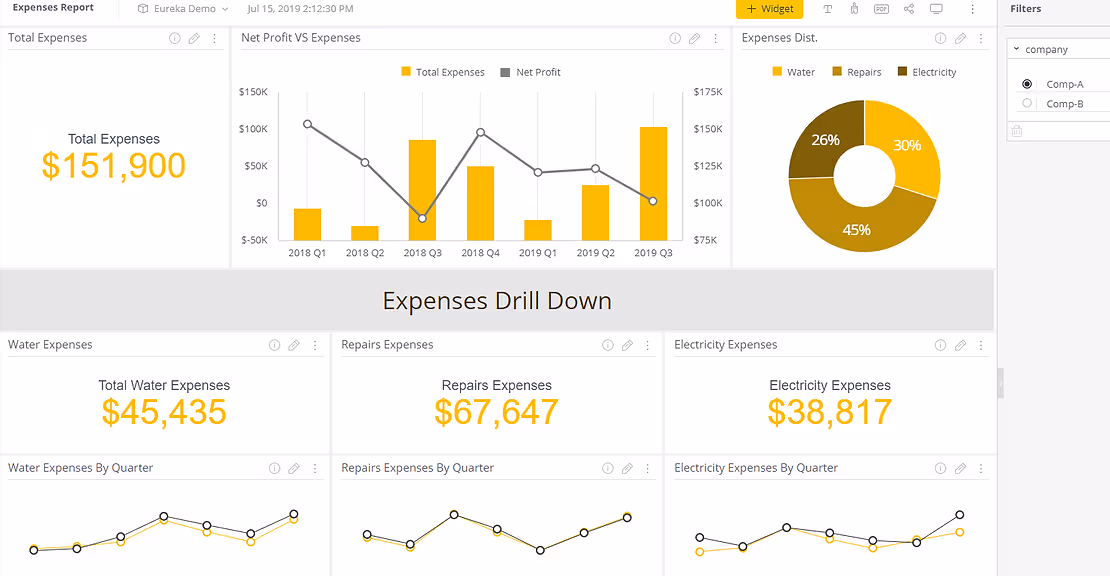
6. Click on ‘Refresh Data’:
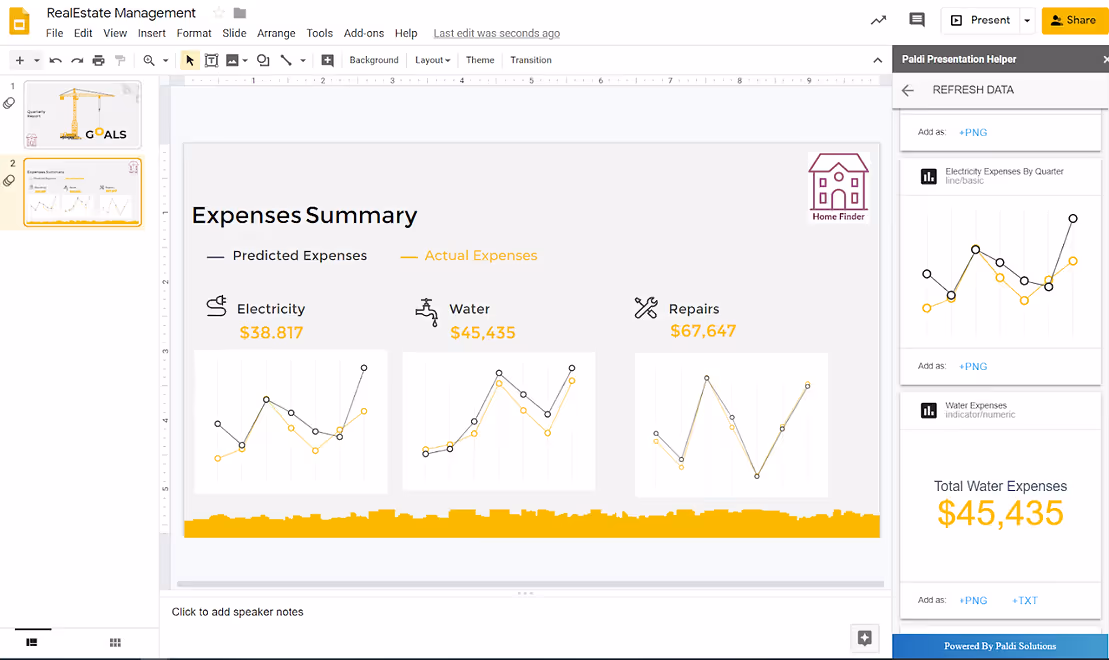
And that’s it 🙂
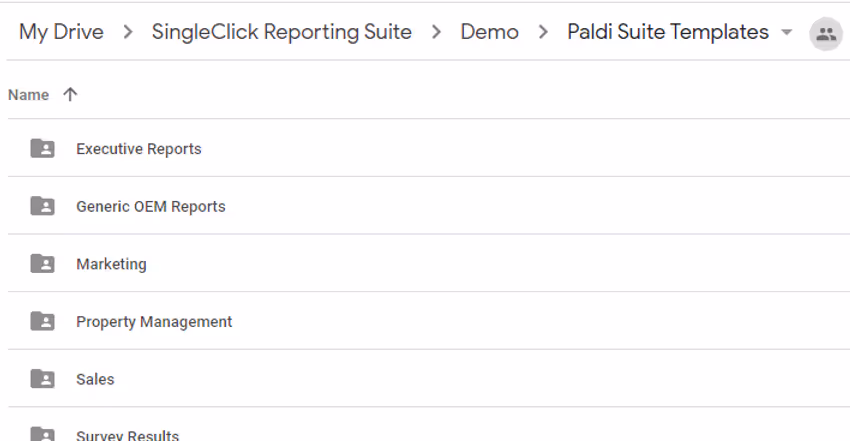
Need some inspiration? Use our predefined templates library:

See this plugin in action
Get a personalized demo and discover how PALDI Solutions can transform your Sisense dashboards.
Book a free demo
Browse 70+ Certified Add-Ons
Go to Sisense Add-ons MarketplaceGo to Sisense Add-ons Marketplace
Enhance your Sisense Experience With our Top Rated Reporting Suite
Clients who use these with the Exports Enhancements
see faster adoption, richer insights, and greater ROI.
see faster adoption, richer insights, and greater ROI.


Flexi BloX
Build rich, custom layouts in Sisense dashboards with drag-and-drop control — no code needed
Best Seller

Advanced Table With Aggregation
Discover a vast array of powerful new capabilities to help elevate your tables to the next level!
Best Seller

Advanced Expandable Pivot Table
Get maximum analytics capabilities with Paldi’s Expandable Pivot plugin.
Best Seller

Leave the implementation to us.
"With the help of Paldi Plugins, you can just click and it’s there.
We were able to leverage Sisense to create a better user experience from a designer and user perspective."

HAMZA
/ Head of Data Analytics
5x
Faster Dashboard Interactions
60+
Predefined Dashboards Launched
90%
of Non-Technical Users Onboarded


