

.svg)
Advanced Drill Treemap
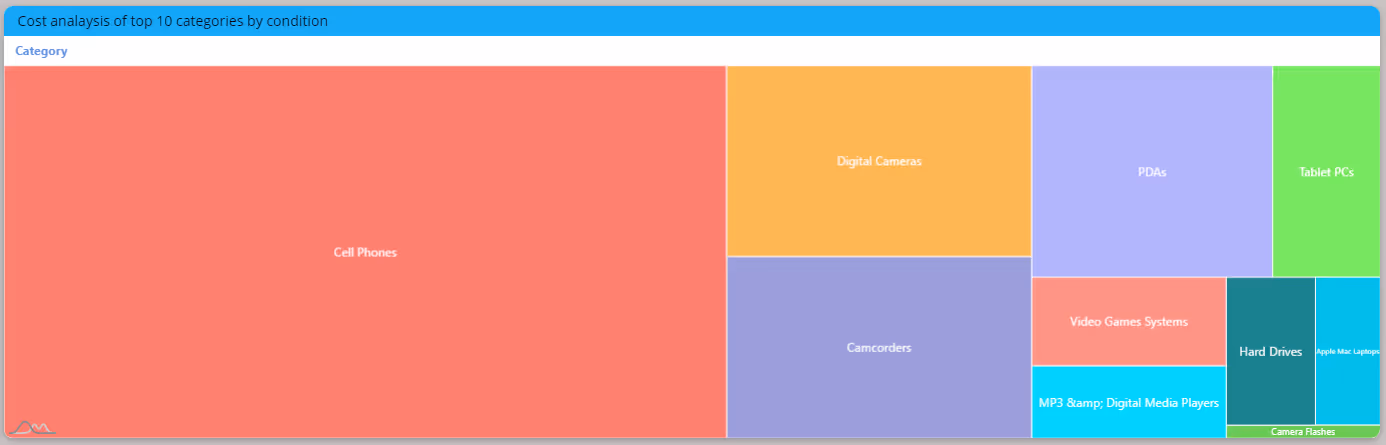
A Treemap is a data visualization technique used to display hierarchical data in a hierarchical structure of nested rectangles.
Each rectangle in the Treemap represents a specific data element, and the size and color of the rectangles can convey additional information such as quantity, value, or category.
The Advanced Drill Treemap is a remarkable Paldi plugin that allows users to create stunning Treemap widgets. With the capability to drill down through up to four levels of data, users can delve deep into their datasets, uncovering valuable information and patterns.

Key Highlights & Features:
- Extends drilling functionality to four levels.
- Enables customized color selections for individual hierarchy levels.
- Visually striking widgets.
- User-friendly interface for effortless chart creation and exploration.
- The “No-Coding” Paldi Experience.
Advanced Drill Treemap:
Contact us for a live demo and immediate free trial!
Simply send a request to inquiries@paldi.solutions


Enhance your Sisense Experience With our Top Rated Reporting Suite
see faster adoption, richer insights, and greater ROI.


"With the help of Paldi Plugins, you can just click and it’s there.
We were able to leverage Sisense to create a better user experience from a designer and user perspective."


