

.svg)
Advanced Funnel Chart
Visualize sequential processes with a funnel chart packed with features.
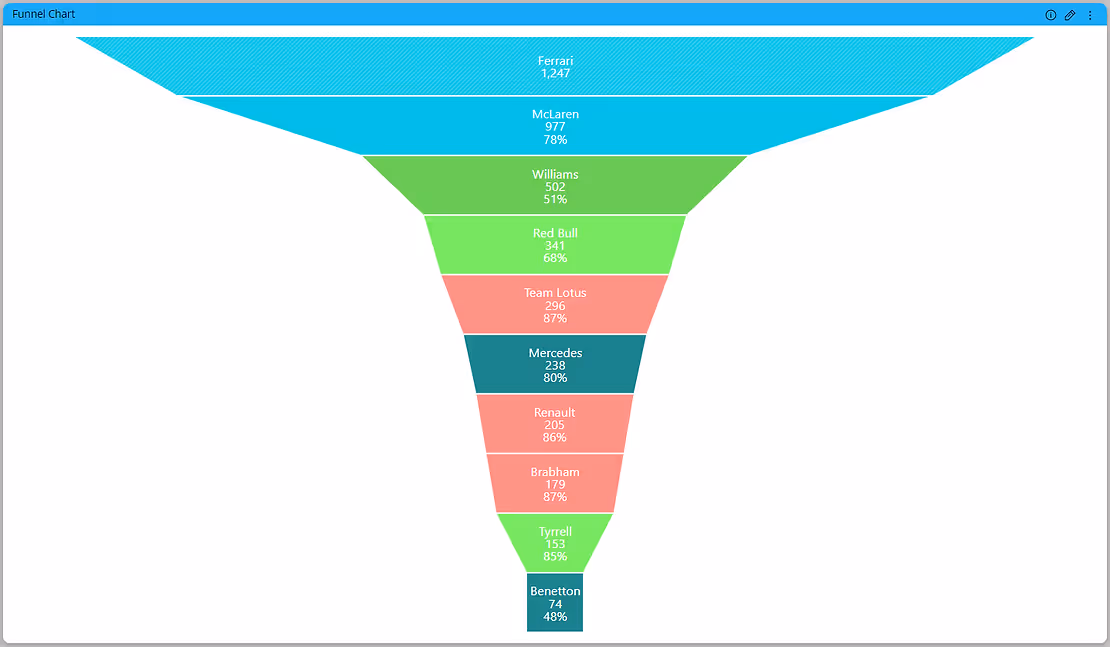
Funnel charts are useful for visualizing processes that have sequential, linked stages.
For example, consider a sales funnel that follows consumers through the following stages: Lead > Response sent > Contract > Deal closer > Close. The funnel's form shows the health of the process at a glance.
Paldi’s “Advanced Funnel Chart” is vital if you’re:
- Analyzing Data In a sequential manner and moving through at least 3 stages.
- Calculating potential (revenue/sales/deals/etc.) is by stages.
- Calculating and tracking conversion and retention rates.
- Analyzing and revealing bottlenecks in a process.
- Analyzing and tracking progress and the success of click-through advertising/marketing campaigns.
Key Features
- Invert chart.
- Dynamic sizing - decide whether you would like the size of items in the chart to correspond to values, or to have a fixed size.
- Sort a funnel by values or alphabetically.
- Hide prefix - control the step label visibility by trimming characters.
- Full customization and styling of labeling.
- Add additional information when hovering on stages.
- Built-in jump to dashboard.
- Built-in pop up windows.
- Apply any conditional formatting.
See it in Action:

See this plugin in action
Get a personalized demo and discover how PALDI Solutions can transform your Sisense dashboards.
Book a free demo
Browse 70+ Certified Add-Ons
Go to Sisense Add-ons MarketplaceGo to Sisense Add-ons Marketplace
Enhance your Sisense Experience With our Top Rated Reporting Suite
Clients who use these with the Exports Enhancements
see faster adoption, richer insights, and greater ROI.
see faster adoption, richer insights, and greater ROI.


Flexi BloX
Build rich, custom layouts in Sisense dashboards with drag-and-drop control — no code needed
Best Seller

Advanced Table With Aggregation
Discover a vast array of powerful new capabilities to help elevate your tables to the next level!
Best Seller

Advanced Expandable Pivot Table
Get maximum analytics capabilities with Paldi’s Expandable Pivot plugin.
Best Seller

Leave the implementation to us.
"With the help of Paldi Plugins, you can just click and it’s there.
We were able to leverage Sisense to create a better user experience from a designer and user perspective."

HAMZA
/ Head of Data Analytics
5x
Faster Dashboard Interactions
60+
Predefined Dashboards Launched
90%
of Non-Technical Users Onboarded


