.webp)
A suite of tools that empowers users with intuitive self-service, flexible filtering, custom styling, and optimized performance — all wrapped in an accessible, modern dashboard experience.
- Advanced Self-Service Tools:
Let users explore data their way with dynamic dashboards, chart/measure switching, and no-code customization. - Flexible Filtering Options:
Modern UI for advanced filters, date ranges, hierarchical selectors, and bookmarks for rich, intuitive filtering. - Admin & Optimization Features:
Streamline management, improve performance, reduce infrastructure costs, and enhance query handling. - Design & Styling Flexibility:
Customize dashboards with advanced styling, global filters, and script management for a polished result. - Accessible & Intuitive Experience:
Meet web accessibility standards while delivering a user-friendly, professional interface.

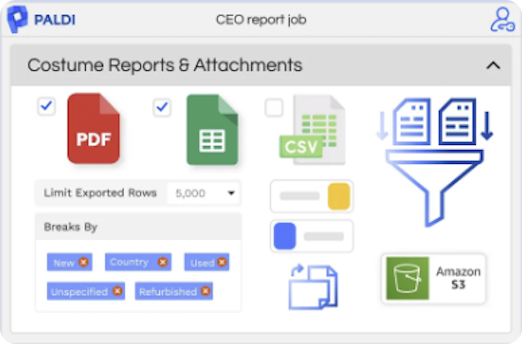
Action Table - Secured Writeback
- Effortlessly write back data points directly into your SaaS database.
- Fully compatible with top platforms like Amazon Redshift, Snowflake, Databricks, Google BigQuery, and more.
- Ensure secure writeback to maintain data integrity and compliance.
- Leverage accessible API endpoints for advanced custom actions and seamless integrations.
- Empower self-service BI by enabling viewers to collaborate directly within Sisense dashboards.

Viewer Dashboard 2.0
ldi’s “ Viewers Dashboard” lets you supercharge your viewers with true self-service BI, letting them design their own dashboards!
With this plugin, all you will need is to :
- Create a single Viewers Dashboard widget
- Embed it as a standalone page within your application
- Let viewers create and manage their own dashboards effortlessly.
- Keep utilizing any Sisense built-in feature like data security, filters, AI etc’

Lazy Loading
- Only widgets that are shown in the dashboard will send a query.
- Reduce costs and get an immediate ROI.
- Best for databases such as: Athena, RedShift, BigQuery, Data Bricks, Snowflake, and Azure.
- boost performance for every data source (ElastiCube\Live model).
- The performance boost is even more noticeable when the dashboard has Tabber or Accordion.

Advanced Filters
- Option to lazy load values when the dimensions are very big.
- Fully customize the style and layout of the dropdowns from the design panel.
- Fully customize Apply/Reset buttons.
- Viewers can define and save filters selection to their favorite selections (data segmentation/preset).
- Option to use different dependency modules between filters.

Widget Script Manager
- Enjoy the benefits of a plugin while keeping the flexibility of the widget scripts.
- Save time on developing and deploying your widget scripts.
- Prevent widget scripts discrepancies between dashboards.
- Can be easily integrated within your Git repository.
.webp)
Date Range Filter
- Interactive "From" and "To" calendar date pickers.
- Easily define the filter presets.
- Configure a default filter selection that will be set whenever you open the dashboard, for all users.
- Hide the predefined Filters list if it's not needed.
- Create more than one date filter (for different date fields) in the same dashboard.

Advanced Input Parameters
- Increased adoption with powerful interactive dashboards.
- Intuitive on the fly What-If analysis.
- Completely dynamic and managed in the dashboard - no need for any data model change.
- Seamlessly interact with your data using Parameter Inputs.
- Works with ALL possible formula functions.

Chart Type Switcher
- Easily switch between different chart types on any dashboard and save precious dashboard real-estate.
- Helps to reduce the number of widgets on users’ dashboards.
- A strong selling point for OEM deployments.
- Supports all Sisense chart capabilities.
- No need for a sophisticated configuration file.

Filters Catalog
- Allow Viewers to select their filters from a predefined list of filters.
- Highly interactive, dynamic and responsive dropdown filters widget.
- Special behavior within PDF Exports.
- Works great with high cardinality dimensions (even millions of values).

SVG Mapper And Shapes Builder
- Create interactive maps by drawing custom shapes and mapping data onto SVG formats in Sisense.
- Export all layers to PowerPoint, with each layer as an individual slide.
- Plot multiple measurements per layer for comprehensive insights.
- Utilize interactive click-to-filter features and detailed tooltips for enhanced data exploration.
- Combine multiple data points and locations with multi-layer and multi-measurement.

Control Table Columns
- Optimized for use cases with a large number of columns.
- Built-in performance booster for heavy dashboards.
- Supports all table widgets.
- Comes with styling and customization options.
.webp)
Pulse Enhancements
- Easily navigate Pulse alerts by filtering dashboards in a structured folder view.
- Quickly find alert sources without manually searching through dashboards.

Advanced Dim Switcher
- Dynamically switch between dimensions in widgets.
- Completely managed in the dashboard - Zero code approach.
- Performance booster for heavy dashboards.
- Supports all existing charts capabilities.
- Compatible with all Sisense visualization charts.

Tree Filter
- Expand and collapse data nodes.
- Excel-like Search & Select functionality.
- Single-Selection vs Multi-Selection.
- Option to use different dependency modules between filters.
- Null values handling.
- Custom selection label.
- Customize the style and layout of the dropdowns and buttons.
_PNG.webp)
Advanced Pivot Toolbar
- Allow viewers to build their own pivot views.
- Made to boost performance on heavy dashboards.
- Integrated with out-of-the-box Sisense native pivot tables.
- Fully customize the style of the pivot header.
- Limit the number of controlled measures and dimensions.

Query Optimizer
- The most efficient tool on the market for optimizing user queries.
- Up to a 75% reduction in processing time.
- Processing time won’t be affected by the amount of filters or the complexity of the data model.
- This plugin will massively reduce your server costs by saving on computing resources..
.webp)
Advanced Measure Changer
- Dynamically switch between measures in widgets.
- Completely managed in the dashboard - With zero code approach.
- Performance booster for heavy dashboards.
- Supports all existing charts capabilities.
- Compatible with all Sisense charts.
- Perfectly Integrates with and complements the “Advanced Dim Switcher” plugin.

Filters Bookmarks
- Easily set your favorite values selection for each analysis you would like to perform.
- Predefine filters and save them as bookmarks.
- Bookmark sorting.
- Manual dropdown sorting

Adaptive Global Filters
- Easily maintain filter consistency across multiple dashboards with Sticky FIlters.
- Enable or disable global filters for each individual dashboard as needed.
- Makes navigating between dashboards a smoother experience.

Widgets Catalog
- Empower Users to build dashboards using a set of predefined widgets.
- Build unique catalogs for specific analytical use cases.
- Simple drag & drop dashboard creation via widget selection dialogue.
- Create widgets with preset formulas and make the process easy and code-free for users.

Dashboard Styler
- Uplift your dashboards’ look & feel with a few clicks and get the pixel-perfect design you were looking for - no coding is required!
- Let your designers customize their dashboards’ design with a simple and intuitive UI while boosting their User Experience.
- Easily save different styles as themes and apply them with a single click on a dashboard
- Specially designed for the OEM and embedded use cases, this plugin allows you to create a modern look, based on your desired style guide and beautify your dashboard with limitless capabilities.
- All widget types are supported
Viewers Dashboard
- Allow viewers to build their own dashboards; Make “True self-service BI” more than a slogan.
- Involve users in dashboards design to increase retention.
- Enhance Viewers’ capabilities in building dashboards with an easy drag & drop UI.
- Can be used as a monetization strategy differentiating your platform from competitors.
- Have viewers tell a story with their own data.
Save precious time for your developers and leave the dashboard design for your viewers.

Want to see the
UX Enhancements
in action?
Book A Free Demo!
Our best-selling plugins
Don't forget these!
We encourage our clients to trial our plugins before making a decision.
Happy clients is our number #1 priority.
Happy clients is our number #1 priority.