

.svg)
Viewers Dashboard
Paldi’s “Advanced Viewer Dashboard” supercharges your viewers with true self-service BI letting them design their own dashboards!
One of the most common monetization strategies for OEMs is to allow self-service analytics by providing clients with the ability to build their own custom dashboards. The main challenge is that the clients usually are not familiar with Data Modeling concepts, Facts, Dimensions, and Formulas. Generally speaking, they come from the business side and don’t know enough about BI.
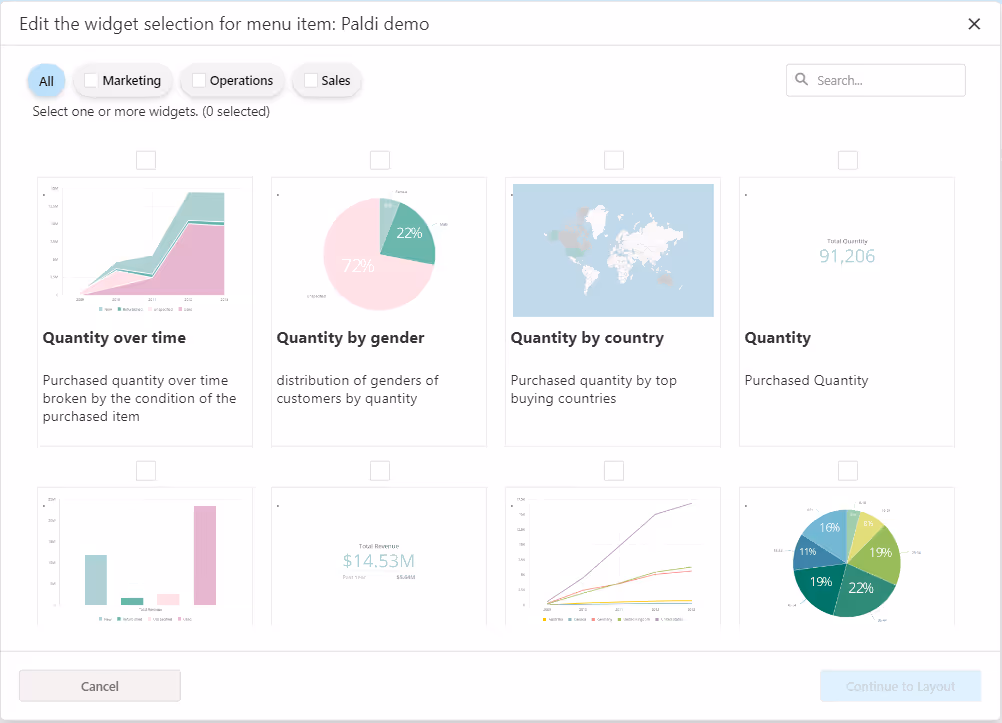
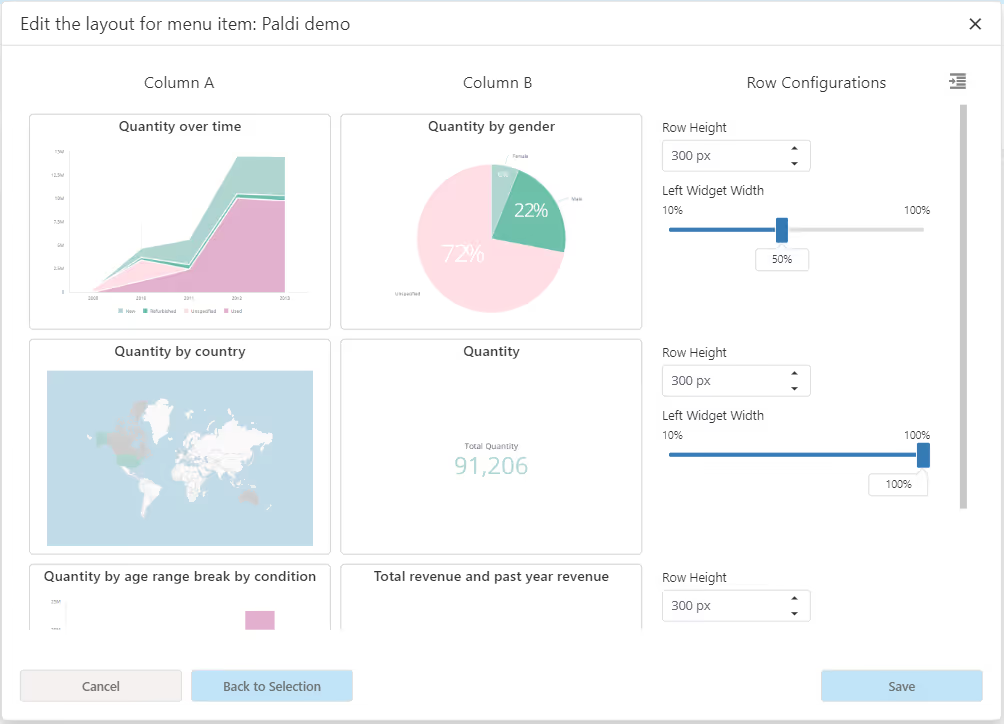
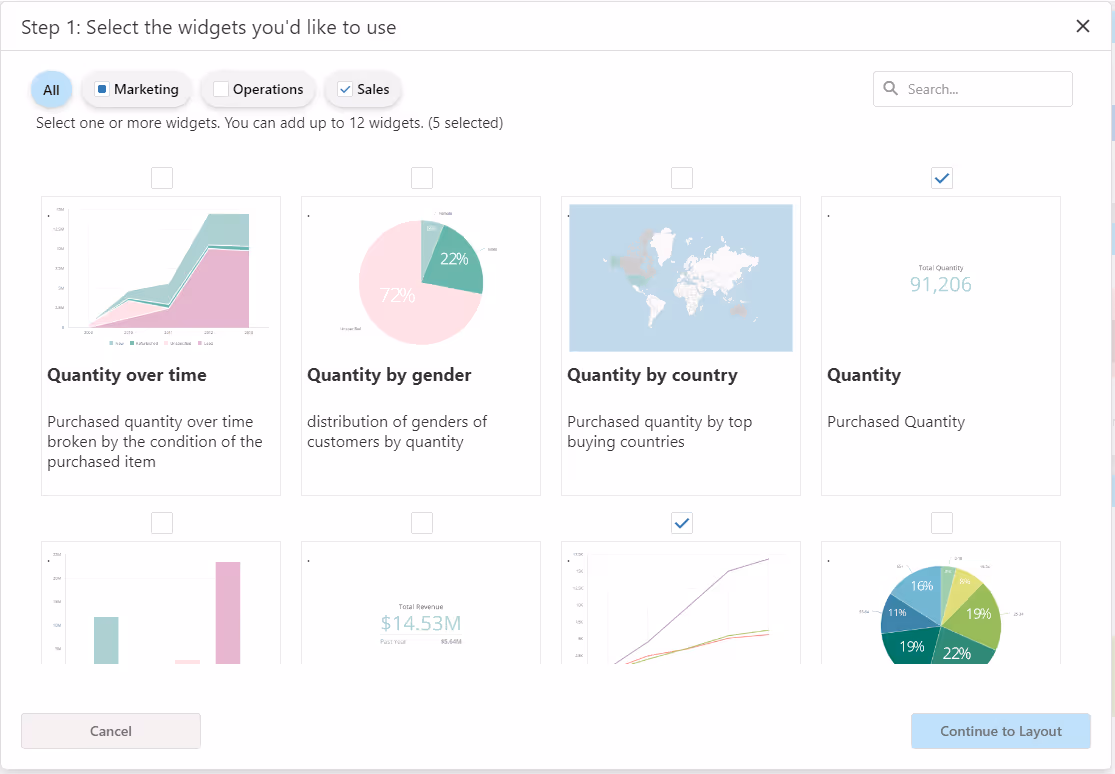
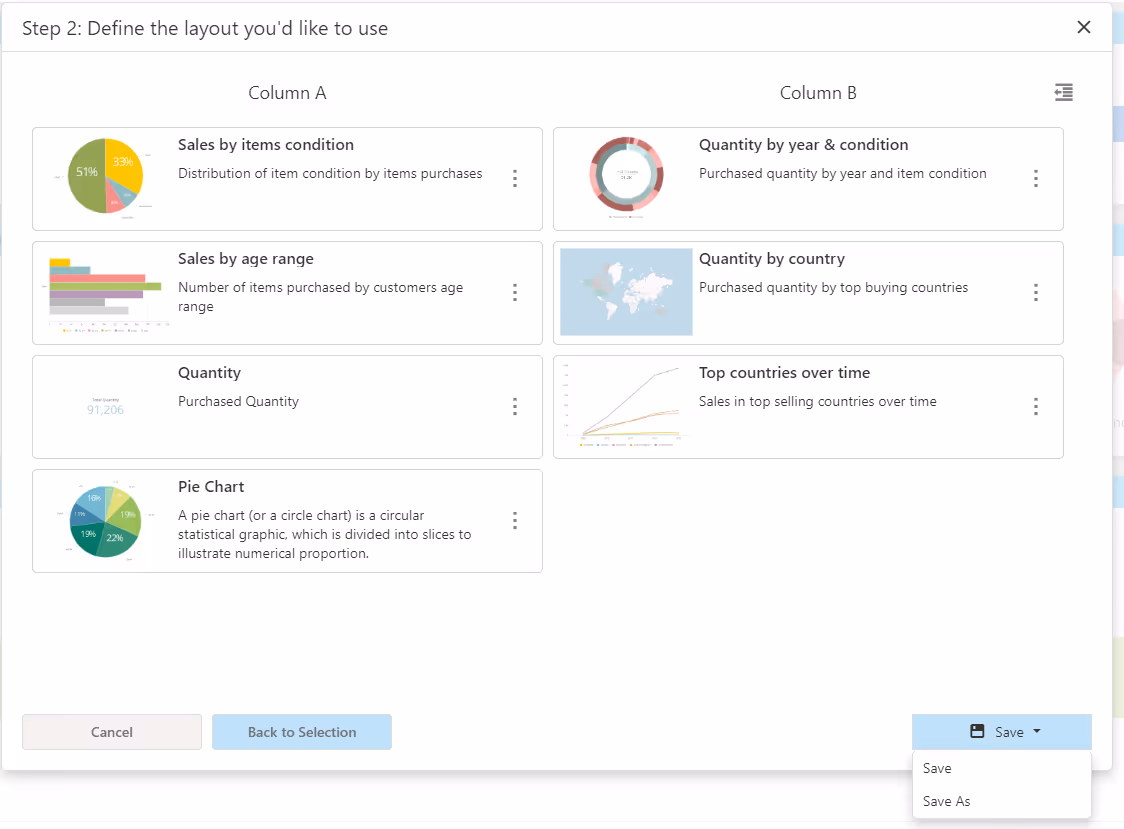
That’s why we at Paldi developed the “Advanced Viewer Dashboard” plugin to allow your viewers to build their own dashboards using a set of predefined widgets that match a specific analytical use case. This eliminates the need to know what’s “under the hood” of the data model and other technical topics. Designers can make a one-time effort to design a dashboard with all available widgets for viewers - this dashboard will serve as the single source of truth. For any future updates - the designers will only need to make changes in one place, making this solution simple to use and maintain. Viewers will be assigned to a single dashboard, and they will be able to create as many dashboards as they need to story-tell their own use case.
- Improve user experience and retention by helping them to become more involved in dashboards design.
- Help your viewers make data driven decisions, yielding faster data analysis and decision making in your organization.
- Can be used as a monetization strategy differentiating your platform from competitors.
- Allows viewers to tell a story with their own data.
- Save precious time for your developers and leave the dashboard design for your viewers.
- save endless time spent on communication between viewers and designers - viewers can create dashboards that make sense to them.
- HIPAA compliance.
- Can be bought as part of our “Induce adoption” package:
Key Features
- Intuitive UX for both viewers and designers
- Built-in lazy loading
- Complete control over the styling:
- Buttons styling
- Menu styling
- Easy drag and drop interface to restructure widgets layout
- Easy to redesign dashboards
- Designers can easily:
- set titles
- set description
- set thumbnails
- Set default dashboards for viewers
- define widgets categories
See it in action!
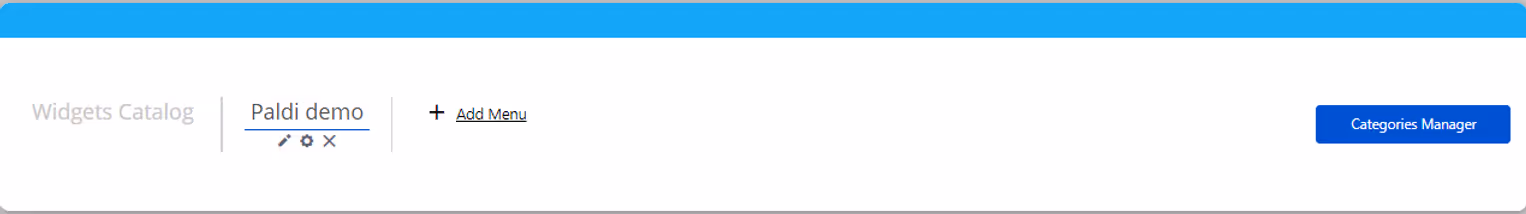
Designer Flow:
Viewer Flow:


Enhance your Sisense Experience With our Top Rated Reporting Suite
see faster adoption, richer insights, and greater ROI.


"With the help of Paldi Plugins, you can just click and it’s there.
We were able to leverage Sisense to create a better user experience from a designer and user perspective."


