

.svg)
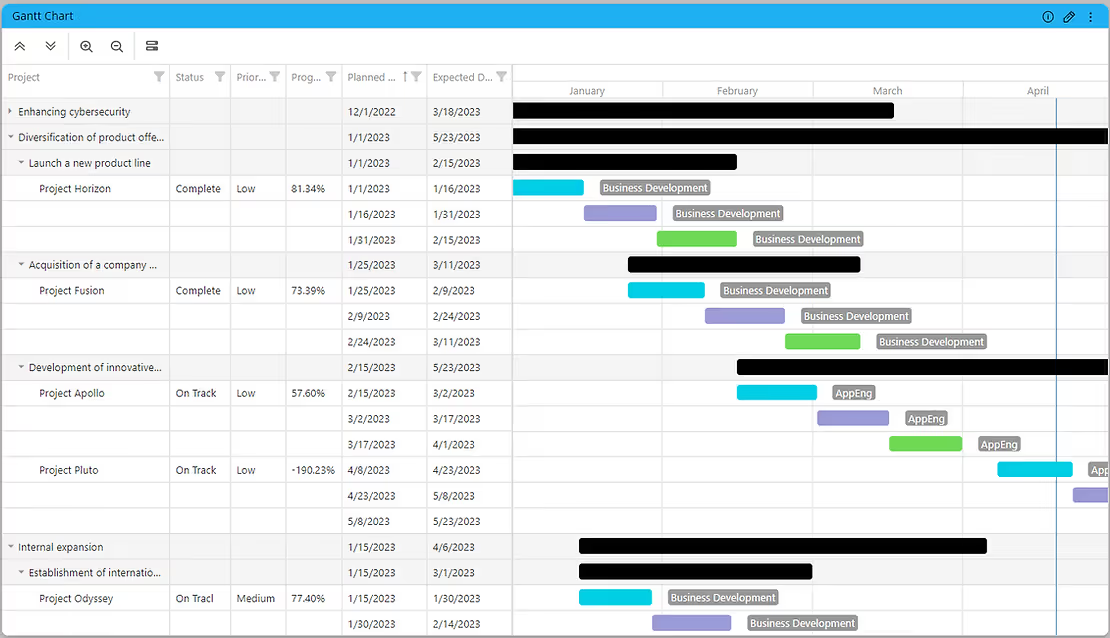
Advanced Gantt Chart
Powerful and easy-to-use tool for plotting tasks on project timeline.
The Paldi “Advanced Gantt Chart” is a user-friendly tool designed to make project planning a breeze!
Organize complex projects, improve workflow visibility, and ensure your teams stay on track. With the option to customize views and resources needed per task, managers can easily plan deliverables while keeping their team members informed.
The Advanced Gantt Chart will help encourage collaboration among your stakeholders, as well as to properly allocate resources for the tasks associated with your projects.
Key Highlights:
- New data processing methods available:
- Compatibility with MS Project data structures
- Independent data structure compatibility
- Display the current date in chart view
- Include descriptive columns as needed
- Handles multiple start and end dates for each task
- Multiple options for task grouping and display
- User-friendly UI/UX design with drag and drop capabilities
- Customizable views of resources needed per task
- Share data over networks quickly and securely
Gantt widget:

See this plugin in action
Get a personalized demo and discover how PALDI Solutions can transform your Sisense dashboards.
Book a free demo
Browse 70+ Certified Add-Ons
Go to Sisense Add-ons MarketplaceGo to Sisense Add-ons Marketplace
Enhance your Sisense Experience With our Top Rated Reporting Suite
Clients who use these with the Exports Enhancements
see faster adoption, richer insights, and greater ROI.
see faster adoption, richer insights, and greater ROI.


Flexi BloX
Build rich, custom layouts in Sisense dashboards with drag-and-drop control — no code needed
Best Seller

Advanced Table With Aggregation
Discover a vast array of powerful new capabilities to help elevate your tables to the next level!
Best Seller

Advanced Expandable Pivot Table
Get maximum analytics capabilities with Paldi’s Expandable Pivot plugin.
Best Seller

Leave the implementation to us.
"With the help of Paldi Plugins, you can just click and it’s there.
We were able to leverage Sisense to create a better user experience from a designer and user perspective."

HAMZA
/ Head of Data Analytics
5x
Faster Dashboard Interactions
60+
Predefined Dashboards Launched
90%
of Non-Technical Users Onboarded


