

.svg)
Over 70+ Certified Sisense Add‑Ons for Every Industry
Sisense Add-ons
Marketplace
Discover, filter, and trial 70+ certified Sisense add‑ons designed to improve workflow, visualization, and data accessibility.
Thank you! Your submission has been received!
Oops! Something went wrong while submitting the form.

Dynamic Custom Fields
UX Enhancements
Enable Sisense to display only the custom fields each customer actually uses.
Best Seller


Filter Panel Enhancements
Sisense Freebies
A smart enhancement to Sisense filters that gives you more control over filter groups and customizes available options.
Best Seller

Intraday Timeline
Advanced Visualizations
A simple and effective tool for visualizing daily activities on a clear intraday timeline.
Best Seller
Control Dashboard Header
Sisense Freebies
Simplify, customize, and control your Sisense dashboard header — without touching roles or code.
Best Seller
Viewers Dashboard
UX Enhancements
Supercharge your viewers with true self-service analytics and let them design their own dashboards!
Best Seller
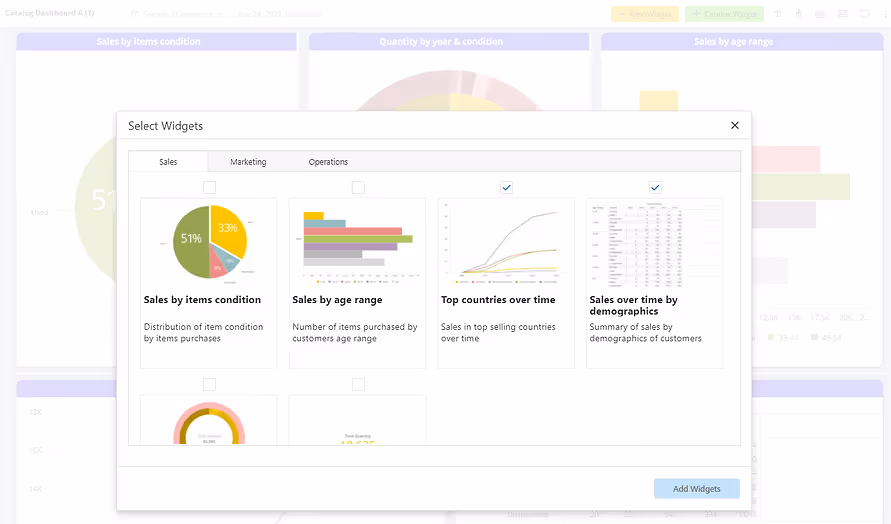
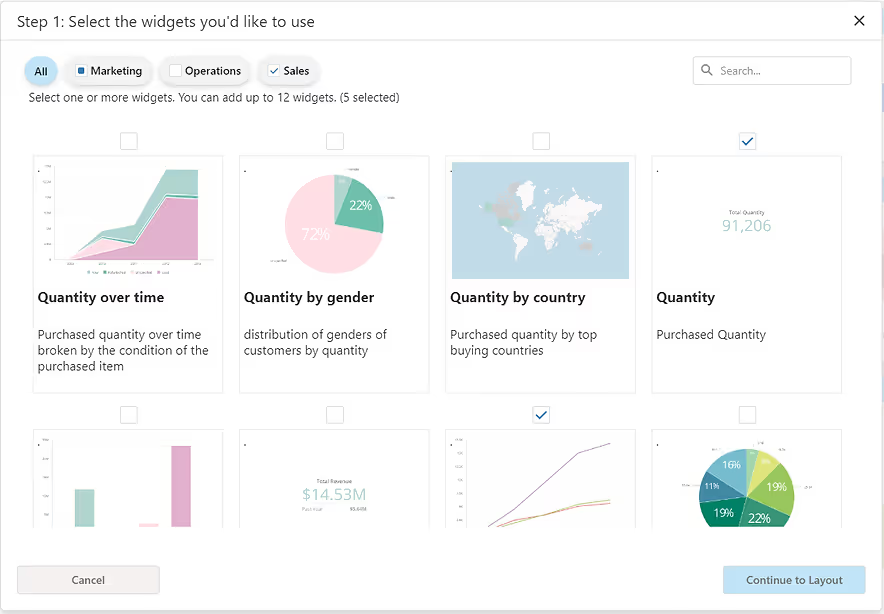
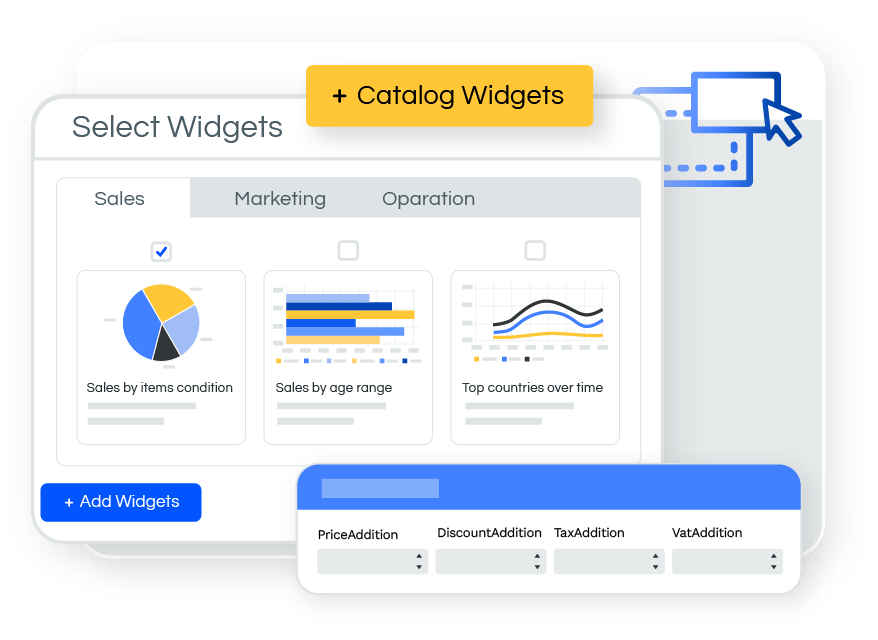
Widgets Catalog
UX Enhancements
Build a catalog of predefined widgets and then allow your designers to easily add those widgets into their dashboards.
Best Seller
Viewer Dashboard 2.0
UX Enhancements
Supercharge your viewers with true self-service analytics and let them design their own dashboards!
Best Seller
Widget Script Manager
UX Enhancements
Manage all your widget scripts in one centralized place and trigger them based on a widgetID, DashboardID and widget type decision rules.
Best Seller
_PNG.avif)
Tree Filter
UX Enhancements
An easy-to-use "tree like" filter widget aimed for presenting a filter that has an internal hierarchy of levels within a single dropdown.
Best Seller

Tree Diagram
Advanced Visualizations
Visualize decision paths and hierarchical structures through branching layouts, and uncover patterns and outcomes within complex data.
Best Seller

Tutorial Button
Sisense Freebies
Easily add tutorial videos, images, or texts to your dashboards.
Best Seller

Pivot2 UI Enhancements
UX Enhancements
Uplift your Pivot2 widgets with new & exciting UI features.
Best Seller

Time Zone Adjustments
UX Enhancements
Automatically sets time zone adjustments by intercepting queries.
Best Seller

Share Dashboard View
Sisense Freebies
Instantly share dashboard URLs with applied filters for effortless collaboration
Best Seller
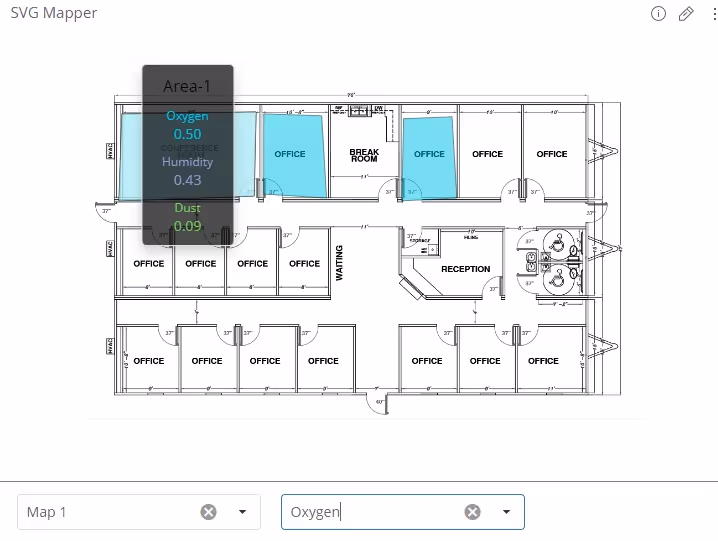
SVG Mapper And Shapes Builder
UX Enhancements
Allow designers to draw shapes on top of image maps and easily connect them to data within the cube.
Best Seller
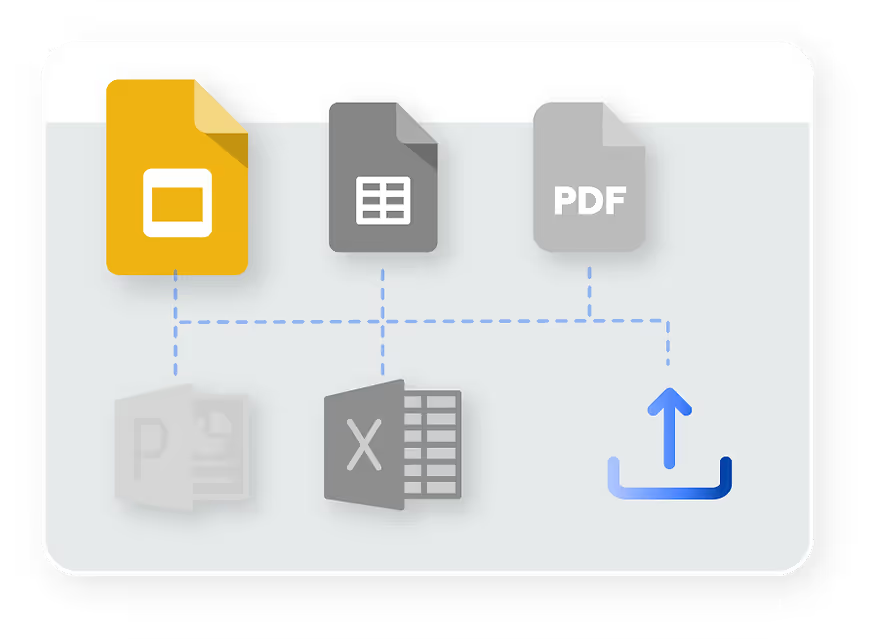
Presentation Builder (Google Slides)
Exports Enhancements
A Google Slides add-on that helps you embed Sisense widgets into presentations and easily update them with a single click.
Best Seller
_PNG.avif)
Range Bar
Advanced Visualizations
Plot and track values within their min-max ranges. This Paldi plugin enables the conversion of the native multi-line Chart into a Range Bar chart with a value plotted in the middle.
Best Seller


Pulse Enhancements
UX Enhancements
Enhance Pulse alert management and maximize its potential
Best Seller
Query Optimizer
UX Enhancements
A plugin that intercepts all queries being sent to the cube and optimize them for best processing time.
Best Seller
Lazy Loading
UX Enhancements
A plugin Boost that prevents dashboards from loading widgets until the user scrolls to them.
Best Seller
M2M Designer Restrictions
Sisense Freebies
A plugin that helps you to enforce dashboard restriction when you have a Many to Many By Design model.
Best Seller
Get User Access
Sisense Freebies
A tool that enables you to see which dashboards a user or a user-group has access to.
Best Seller
Hide Widget Headers
Sisense Freebies
Beautify your dashboards and hide widget headers with a click.
Best Seller
Header Manager
Sisense Freebies
A tool that allows you to easily add new navigation options next to the main Sisense links.
Best Seller
Folder Organizer
Sisense Freebies
Order your folders and dashboards within the navigation tree
Best Seller
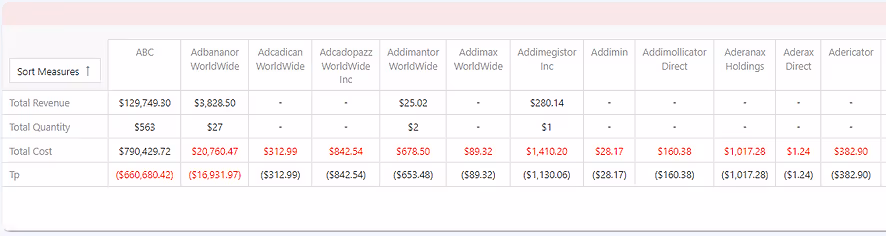
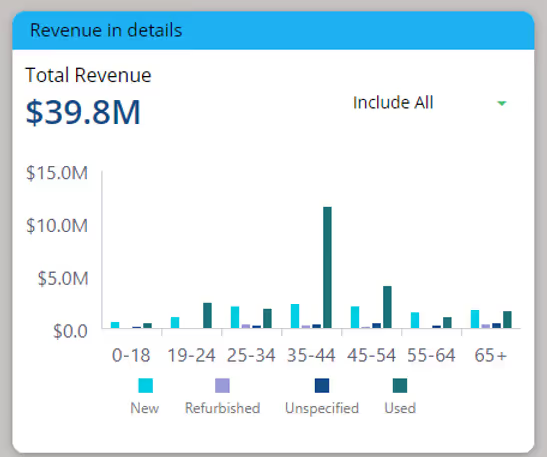
Financial Table
UX Enhancements
A simple table widget that enables you to set different measurements as its rows while having a dim as the column.
Best Seller

Flexi BloX
3
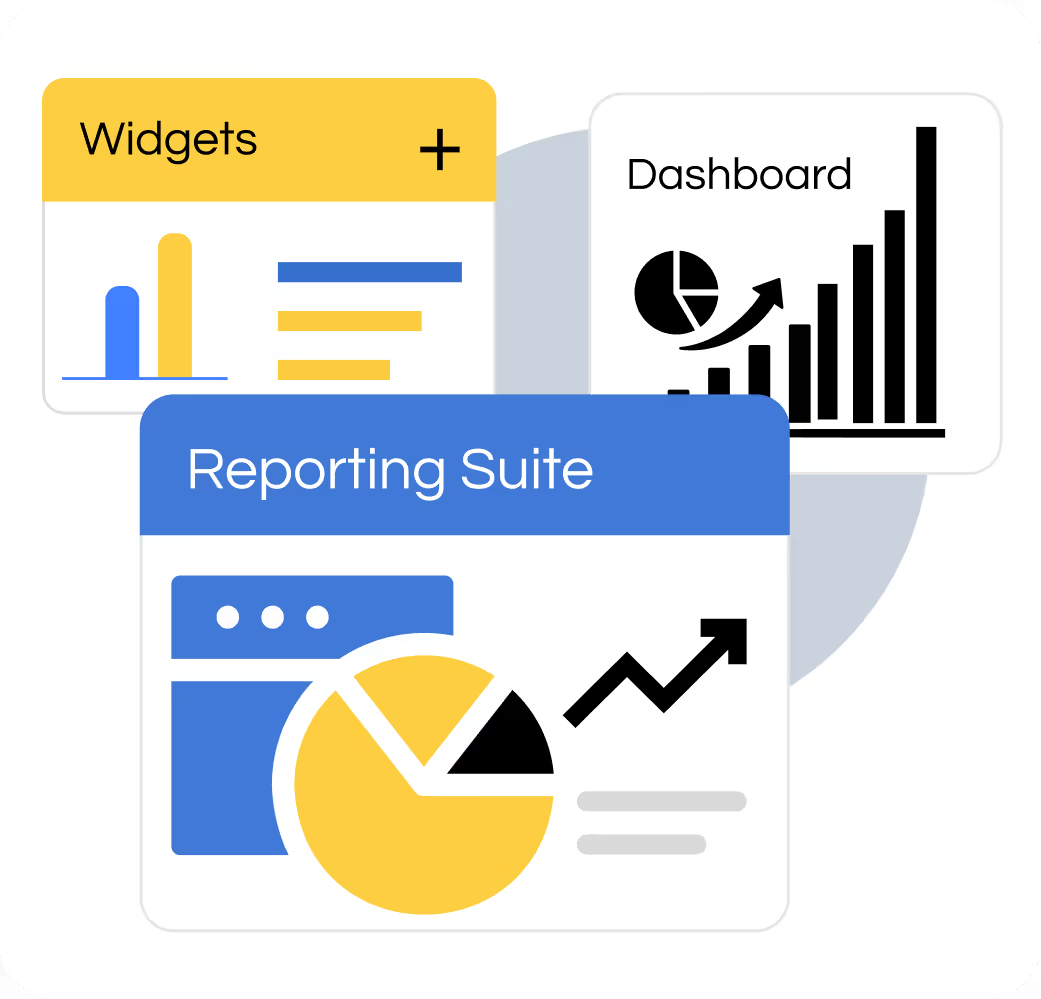
Reporting Suite
Build rich, custom layouts in Sisense dashboards with drag-and-drop control — no code needed
Best Seller
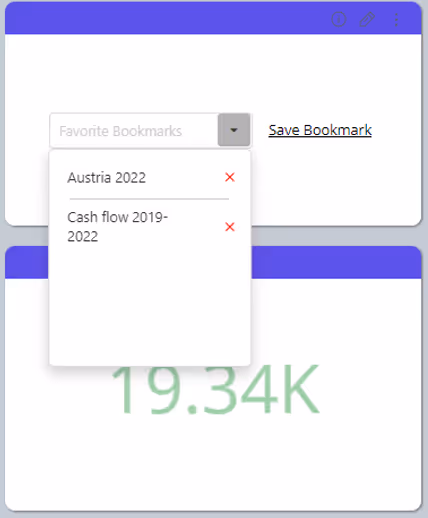
Filters Bookmarks
UX Enhancements
Empower your OEM readiness by defining and saving filter selections as filters bookmarks and share them with tenants.
Best Seller
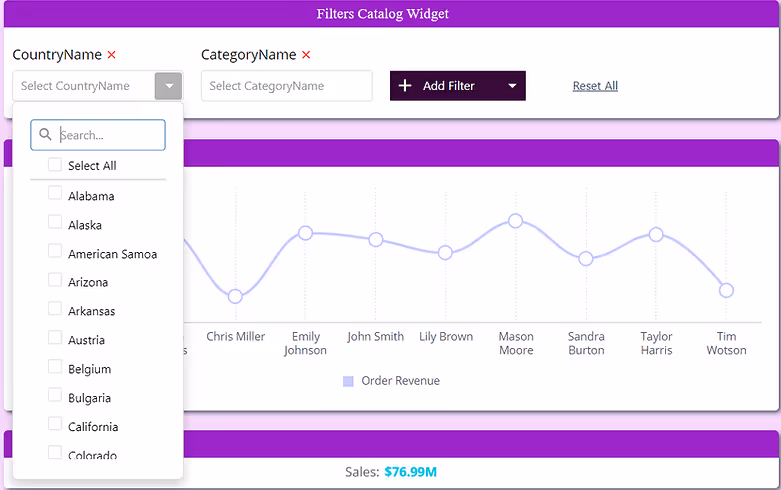
Filters Catalog
UX Enhancements
Enhance dashboard UI by limiting the number of filters visible at once. Allow easy navigation between large number of filters.
Best Seller
Field Analyzer
UX Enhancements
A tool that helps you to understand which dashboards are using certain fields and where exactly they're used within those dashboards.
Best Seller
Field Replacer
UX Enhancements
A handy tool that intercepts all the queries and allows you to rename the field names before they are sent to the cube.
Best Seller
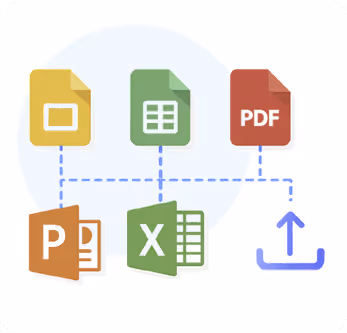
Export To PowerPoint
Exports Enhancements
Easily export dashboards to pixel-perfect PPT presentations.
Best Seller
Export Button
Exports Enhancements
A simple button widget that can be used for several exporting options including the premium Export To Excel module.
Best Seller
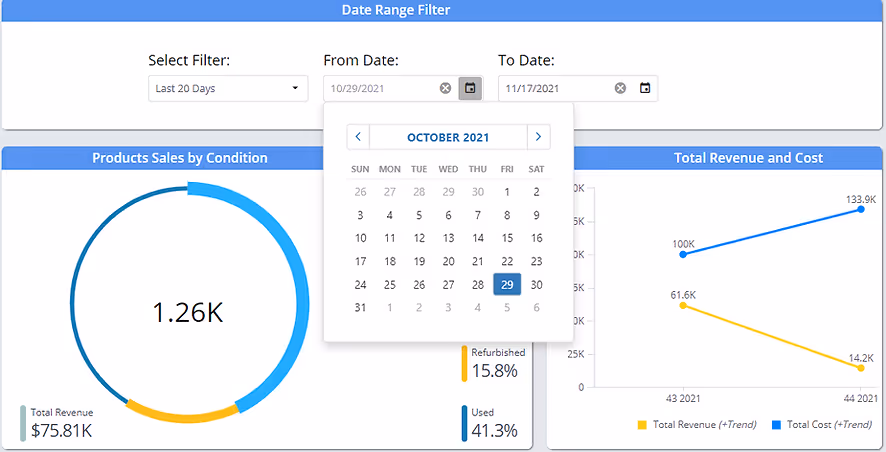
Date Range Filter
UX Enhancements
A widget that allows you to add custom "From" and "To" Date Picker inputs alongside a configurable dropdown of predefined time ranges.
Best Seller
Dashboard Styler
UX Enhancements
Pixel Perfect dashboards with custom design had never been easier.
Best Seller
Export All Tables to CSV
Exports Enhancements
Export all tables to CSV with a single click.
Best Seller
Dashboard Sharing Utility
UX Enhancements
Share multiple dashboards and folders with a single click.
Best Seller
.avif)
Control Table Columns
UX Enhancements
Enjoy better UX/UI by providing users the flexibility to dynamically choose which columns will be displayed within a table widget.
Best Seller
.avif)
Control Exporting Options
Exports Enhancements
A plugin allows designers to determine which export options will be available at the dashboard or widget levels.
Best Seller
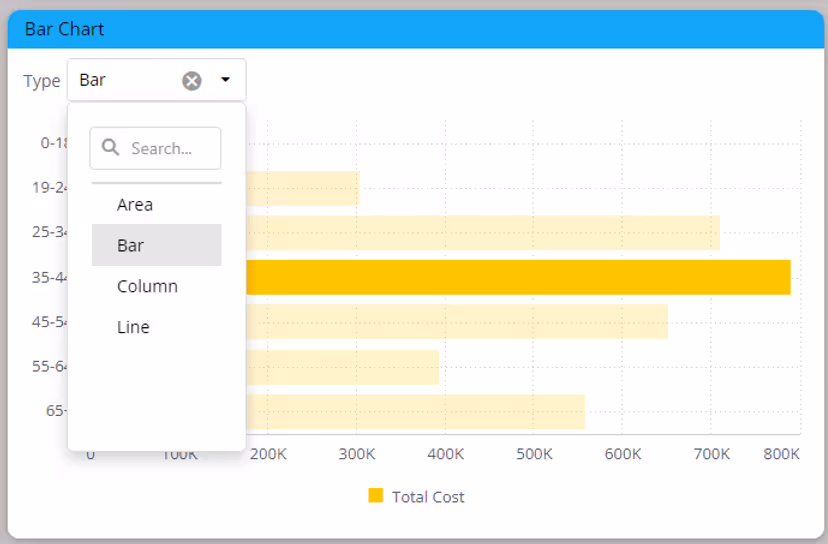
Chart Type Switcher
UX Enhancements
Supercharge your viewers by letting them decide how to visualize their data. Allow viewers to swap between chart types on any widget.
Best Seller
Avoid Over Filtering
Sisense Freebies
Secure Data Privacy across your dashboards by limiting the usage of your filters.
Best Seller
_PNG.avif)
Bi-Directional Chart
Advanced Visualizations
Compare two formulas over a joint Axis while presenting them back to back for better visualization.
Best Seller
Aggregated Table Enhancements
UX Enhancements
Uplift your Table Aggregation widgets with new and exciting UI features.
Best Seller
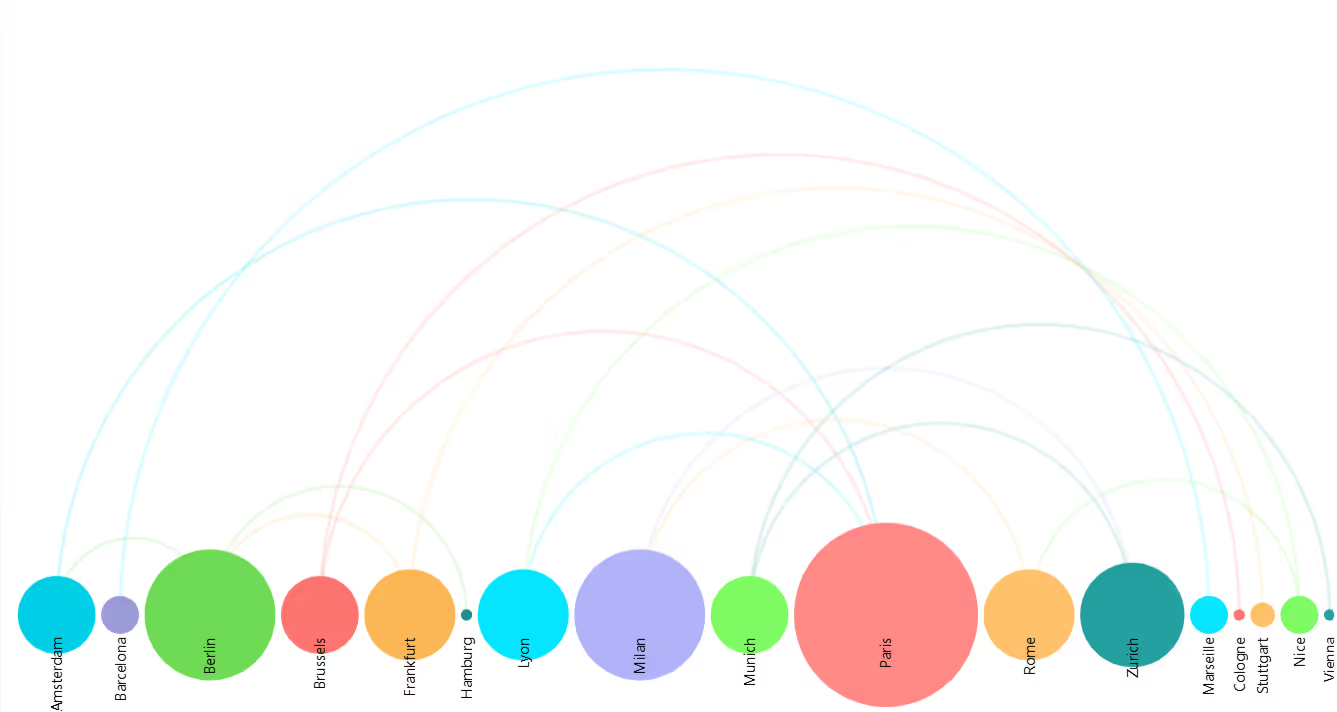
Arc Diagram
Advanced Visualizations
Visualize relationships between entities through curved connections, and uncover patterns and hidden structures within complex data.
Best Seller

Auto PDF Break By Exporter
Exports Enhancements
Export multiple PDFs by looping through dimension values
Best Seller
.avif)
Advanced Tooltip
Sisense Freebies
Adding additional information to a widget’s tooltip has never been easier
Best Seller
.avif)
Advanced Word Cloud
Advanced Visualizations
An interactive word cloud widget that allows a simple way to visualize text data.
Best Seller

Advanced Table With Aggregation
2
Reporting Suite
Discover a vast array of powerful new capabilities to help elevate your tables to the next level!
Best Seller

Advanced Text Widget
Sisense Freebies
Enhance user engagement with a dashboard explanation widget. Add rich text narratives and include links, images, and formatted content.
Best Seller
.avif)
Advanced Sankey Diagram
Advanced Visualizations
A visually captivating flow chart that elegantly illustrates the relationships between the stages of a process, enhancing understanding and insights.
Best Seller
Advanced Measure Changer
UX Enhancements
Improve self-service by enabling giving an option to switch between measures on charts.
Best Seller
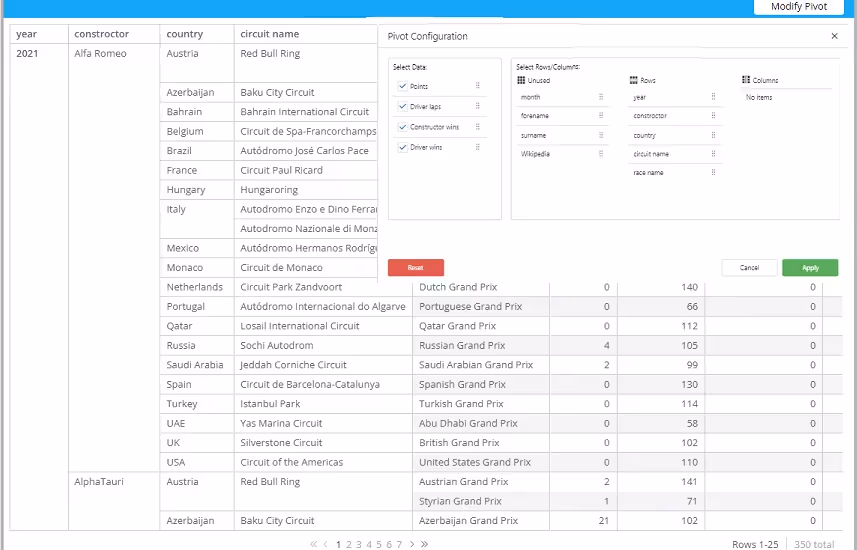
Advanced Pivot Toolbar
UX Enhancements
Allow viewers to build their own custom pivots with an easy drag & drop interface.
Best Seller
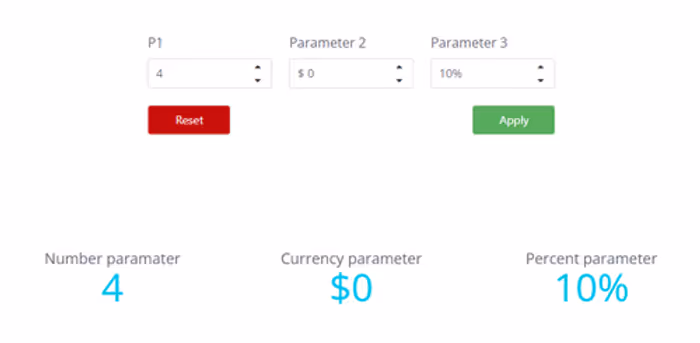
Advanced Input Parameters
UX Enhancements
Unlock the power of “What-If” analysis to your viewers.
Best Seller
.avif)
Advanced Jump To Dashboard
Sisense Freebies
Simplify dashboard navigation with a user-friendly interface, save JTDs configurations as reusable presets, and unlock advanced capabilities. Say goodbye to ad-hoc widget scripting
Best Seller

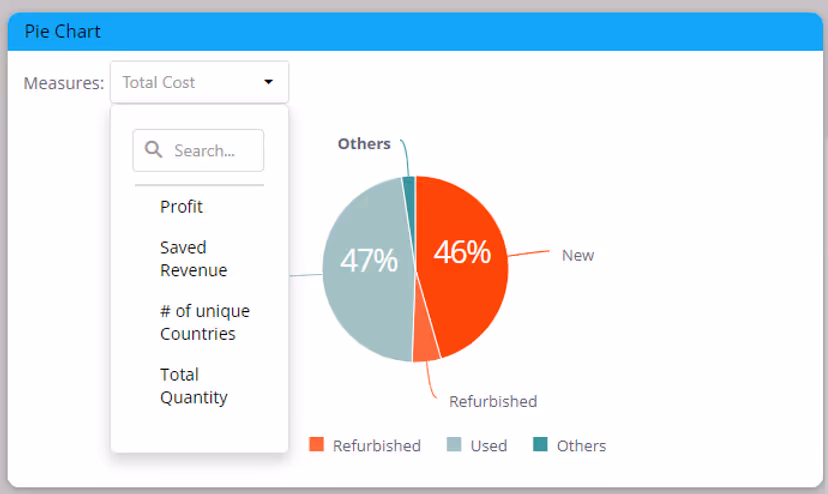
Advanced Pie Chart
Advanced Visualizations
Reveal multi-level data within a single pie chart through an exploding chart feature.
Best Seller
Advanced Filters
UX Enhancements
Interactive, user-friendly filters widget with an enormous amount of useful enhancements.
Best Seller
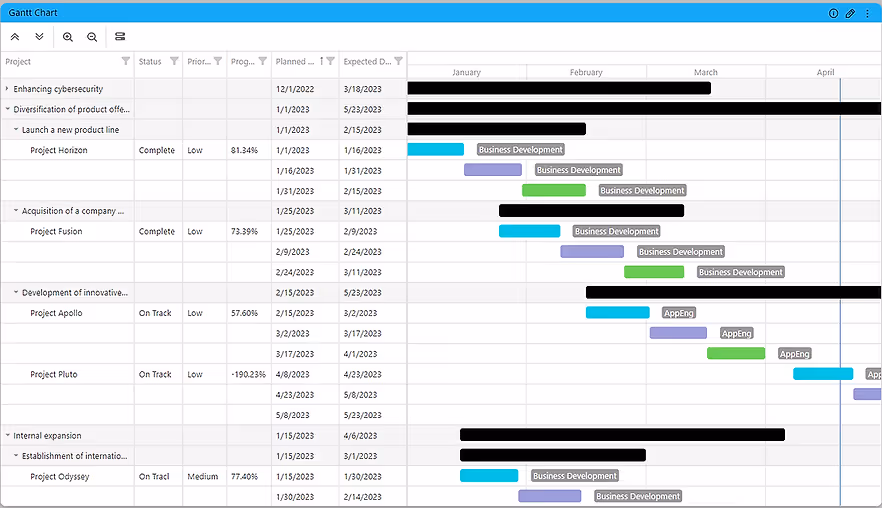
Advanced Gantt Chart
Advanced Visualizations
Powerful and easy-to-use tool for plotting tasks on project timeline.
Best Seller

Advanced Expandable Pivot Table
1
Reporting Suite
Get maximum analytics capabilities with Paldi’s Expandable Pivot plugin.
Best Seller
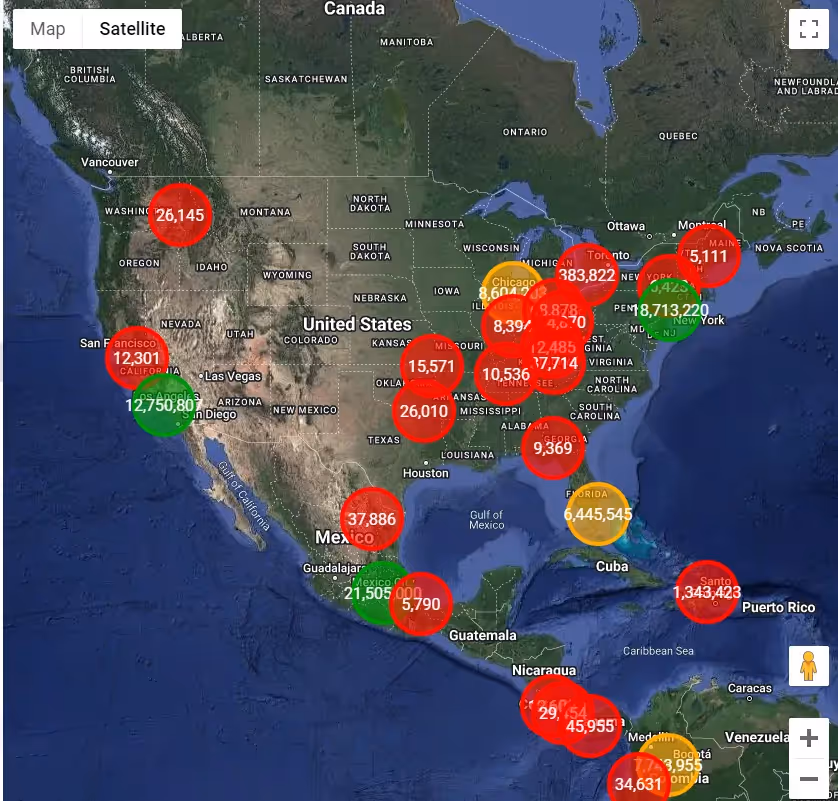

Advanced Google Heat Map
Geolocation Analytics
Plot measures on Google Maps Overview with this tool for visualizing your data points on Google Maps
Best Seller
.avif)
Advanced Funnel Chart
Advanced Visualizations
Visualize sequential processes with a funnel chart packed with features.
Best Seller
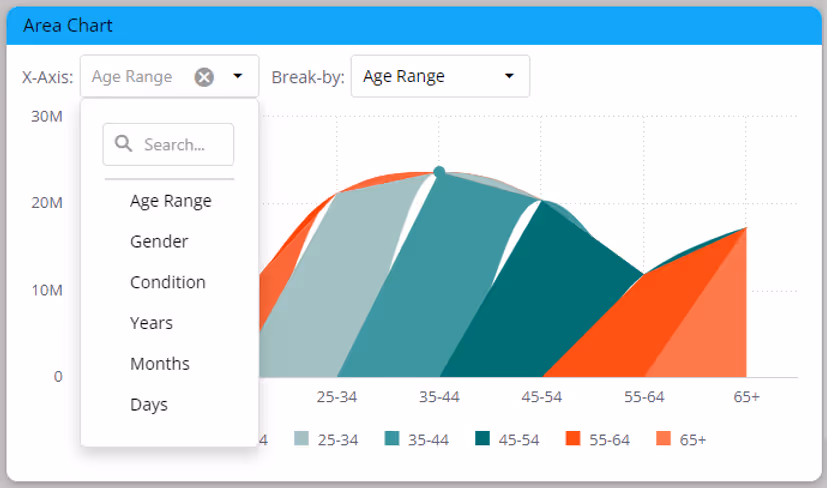
Advanced Dim Switcher
UX Enhancements
Improve self-service by providing the flexibility to toggle between dimensions within a single widget.
Best Seller
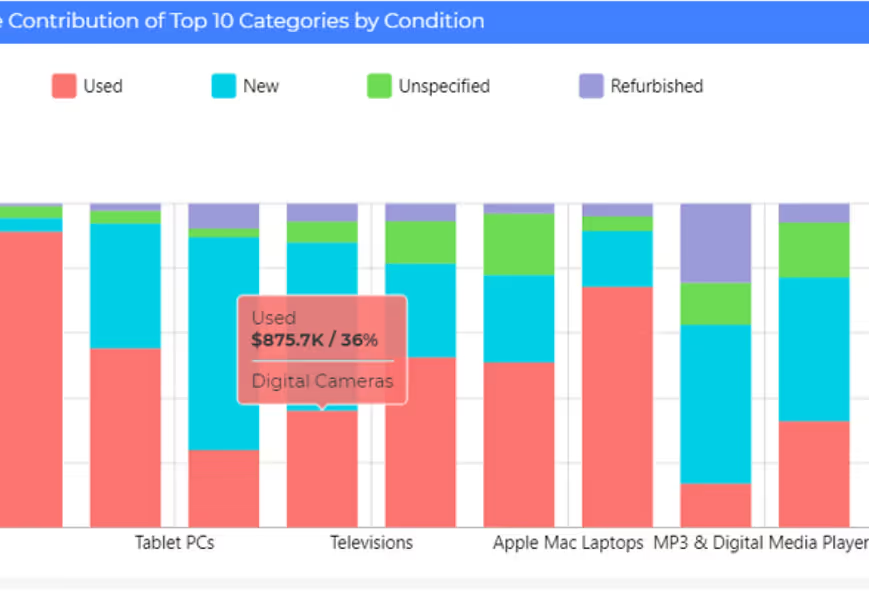
Advanced Column Chart
Advanced Visualizations
Craft powerful column charts with Paldi’s advanced visualization tools.
Best Seller
.avif)
Advanced Drill Treemap
Advanced Visualizations
Cleanly display hierarchical data in the form of nested rectangles proportions.
Best Seller
.avif)
Advanced Chord Dependency Diagram
Advanced Visualizations
Easily visualize complex data relationships and dependency with interactive sleek animations and extensive customization options.
Best Seller
.avif)
Add Widgets On Top
Sisense Freebies
Places newly created widgets at the top of the dashboard instead of the bottom.
Best Seller
.avif)
Adaptive Radial Infographics
Advanced Visualizations
Showcase complex relationships and compare multiple variables with dynamic radial graph
Best Seller
.avif)
Adaptive Venn Diagram
Advanced Visualizations
Visualize data set relationships with Venn diagram, using overlapping circles to illustrate intersections and distinctions for insightful data analysis.
Best Seller

Action Table - Secured Writeback
UX Enhancements
Enable real-time data updates by writing back to databases and external apps from Sisense
Best Seller

Adaptive DeckGL Map
Geolocation Analytics
Advanced map widget for intuitive and interactive spatial data analysis
Best Seller

Accessibility Button Plugin
Sisense Freebies
Meet web accessibility standards for your dashboards.
Best Seller
Adaptive Indicator Card
Sisense Freebies
Effortlessly present rich data insights, indicators and trends while optimizing your dashboard layout
Best Seller
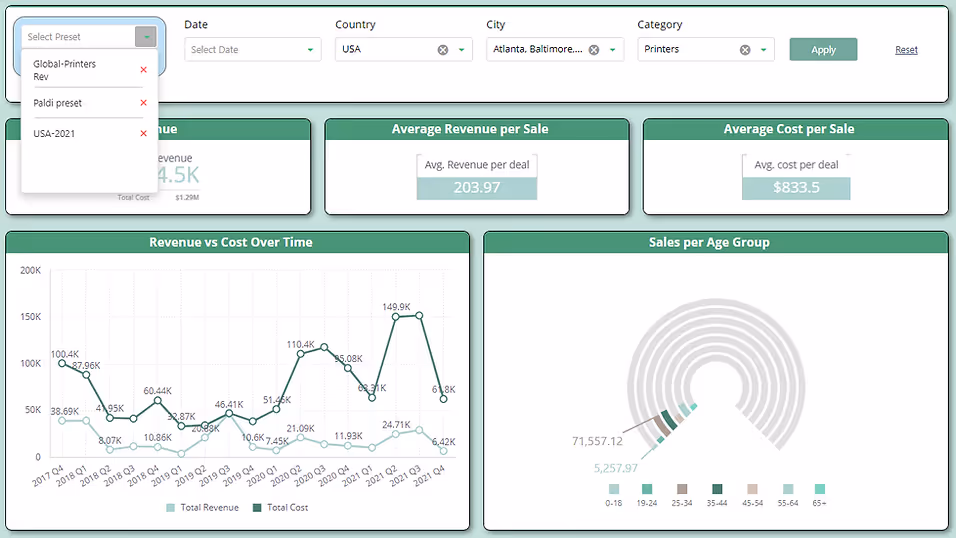
Adaptive Global Filters
UX Enhancements
Enable sticky filters to keep user-selected filter values consistent as you navigate across dashboards.
Best Seller
Adaptive Default Filters
Sisense Freebies
Define the initial dashboard experience by enforcing default values and filters with any required logic .
Best Seller


